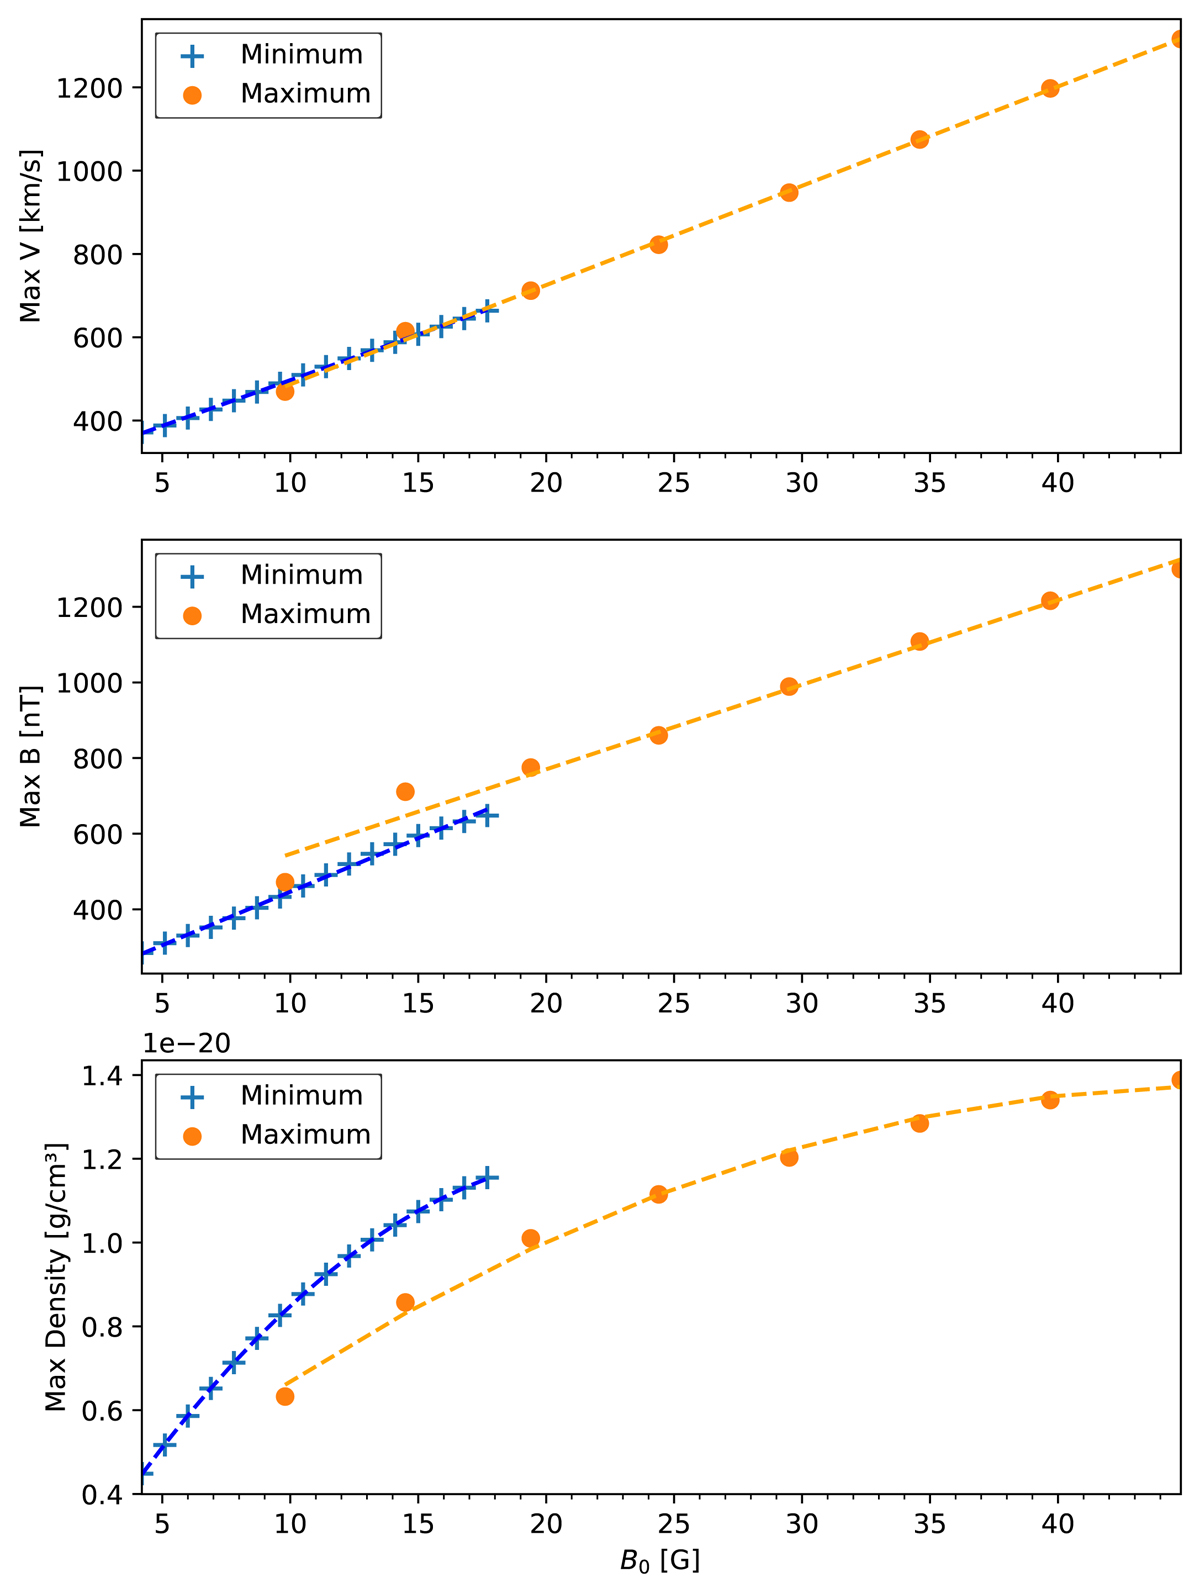
Fig. 12.
Download original image
Maximum values of the different temporal profiles presented in in Figs. 10 and 11. From top to bottom: Maximum of the velocity, of the magnetic field amplitude, and of the density reached at x ≈ −21.5 R⊙ as a function of the initial magnetic field of the flux rope. The “+” markers are for the flux rope in the minimum of activity, while the orange dots correspond to the simulation in the maximum of activity. The dotted lines in orange and blue are polynomial regressions between the different values. The slope of the regressions depends on the solar wind configuration, meaning that the properties of the flux rope are related to its initial characteristics and to the surrounding magnetic field.
Current usage metrics show cumulative count of Article Views (full-text article views including HTML views, PDF and ePub downloads, according to the available data) and Abstracts Views on Vision4Press platform.
Data correspond to usage on the plateform after 2015. The current usage metrics is available 48-96 hours after online publication and is updated daily on week days.
Initial download of the metrics may take a while.