Fig. 1.
Download original image
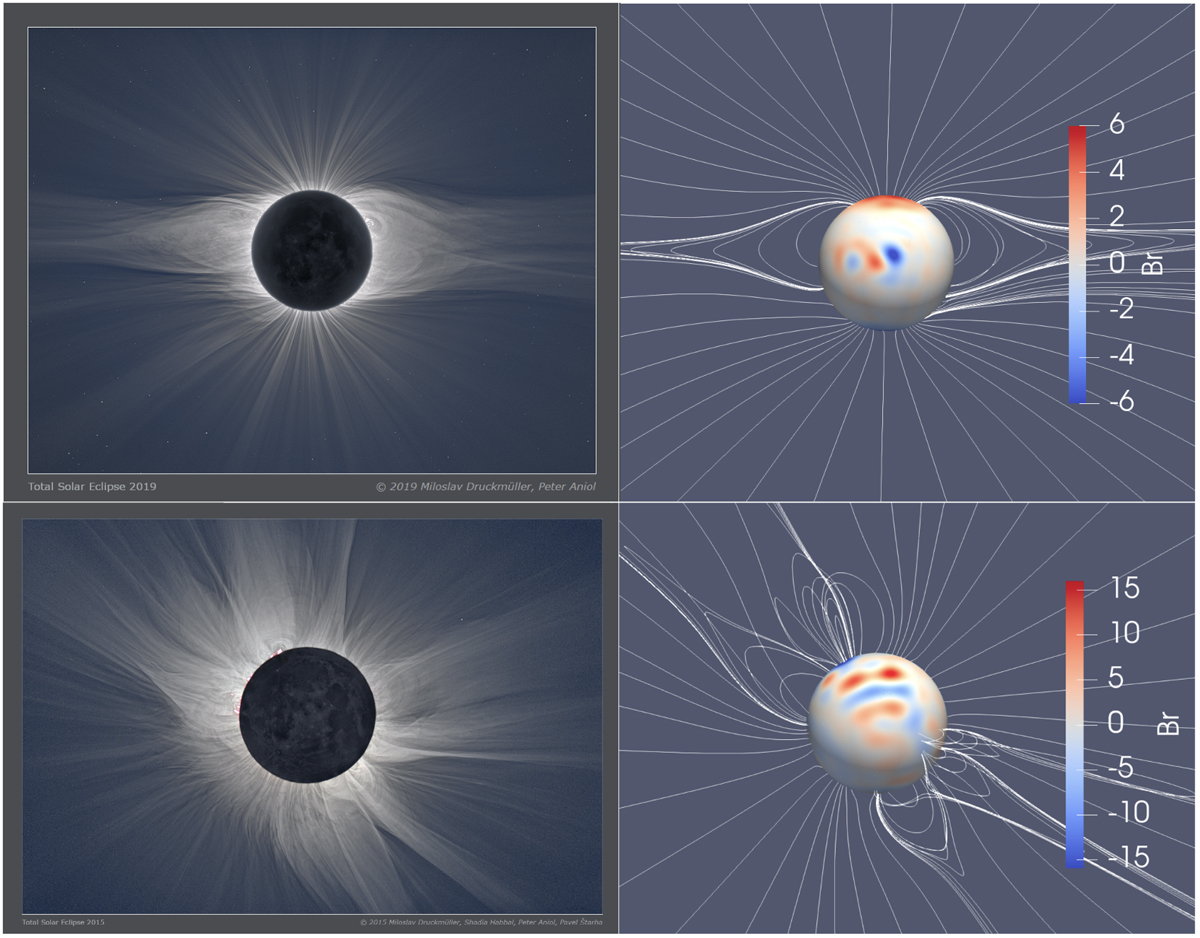
Comparison of the solar eclipse images (left) and numerical results (right) for the case of minimum (top) and maximum (bottom) of solar activity. The minimum activity image corresponds to the solar eclipse of 2 July 2019 (© 2019 Miloslav Druckmüller, Peter Aniol: http://www.zam.fme.vutbr.cz/~druck/Eclipse/Ecl2019ch/Tres_Cruses/TC_347mm/0-info.htm), and the maximum activity image corresponds to the solar eclipse of 20 March 2015 (© Miloslav Druckmüller, Shadia Habbal, Peter Aniol, Pavel Starha: http://www.zam.fme.vutbr.cz/~druck/Eclipse/Ecl2015s/800mm/00-info.htm). The red-blue sphere color map represents the radial component of the photospheric magnetic field expressed in Gauss, and the white lines represent magnetic field lines of the magnetic coronal structures in the plane of sight. The reconstructed main streamers align closely with the position and shape of coronal structures observed in white light.
Current usage metrics show cumulative count of Article Views (full-text article views including HTML views, PDF and ePub downloads, according to the available data) and Abstracts Views on Vision4Press platform.
Data correspond to usage on the plateform after 2015. The current usage metrics is available 48-96 hours after online publication and is updated daily on week days.
Initial download of the metrics may take a while.