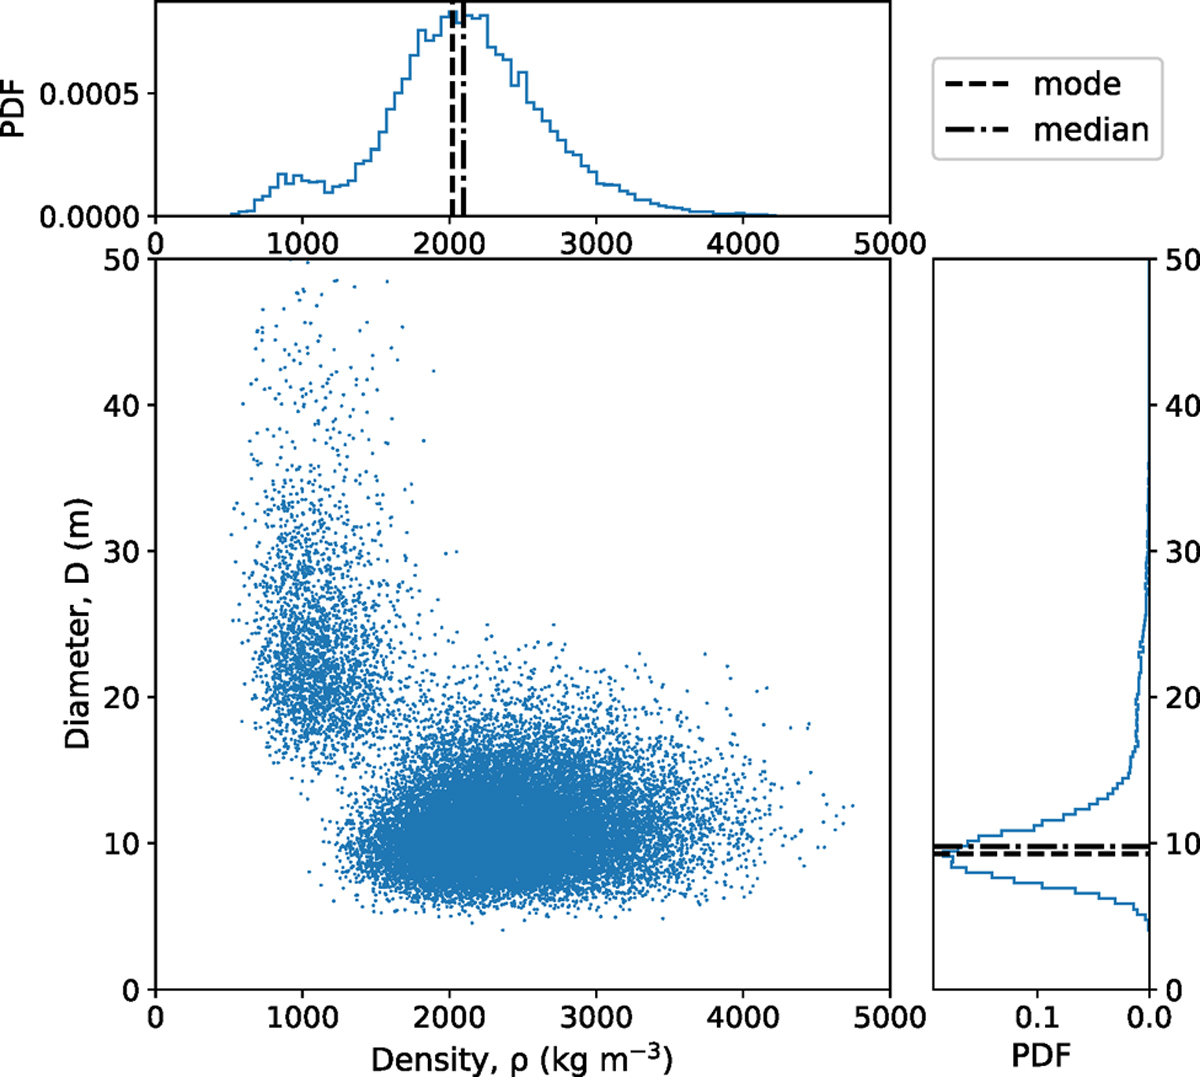
Fig. 8
Download original image
Posterior (resulting) distribution of the parameters of GE1. The main plot shows the density, ρ, against the diameter distribution, D. The upper and right histograms show the marginal distributions of ρ and D, respectively. The results were obtained using the eccentric Yarkovsky model and a heat capacity of C = 600 J kg−1 K−1. The dashed and dash-dotted lines mark the modes and medians of the distributions, respectively.
Current usage metrics show cumulative count of Article Views (full-text article views including HTML views, PDF and ePub downloads, according to the available data) and Abstracts Views on Vision4Press platform.
Data correspond to usage on the plateform after 2015. The current usage metrics is available 48-96 hours after online publication and is updated daily on week days.
Initial download of the metrics may take a while.