Fig. 6
Download original image
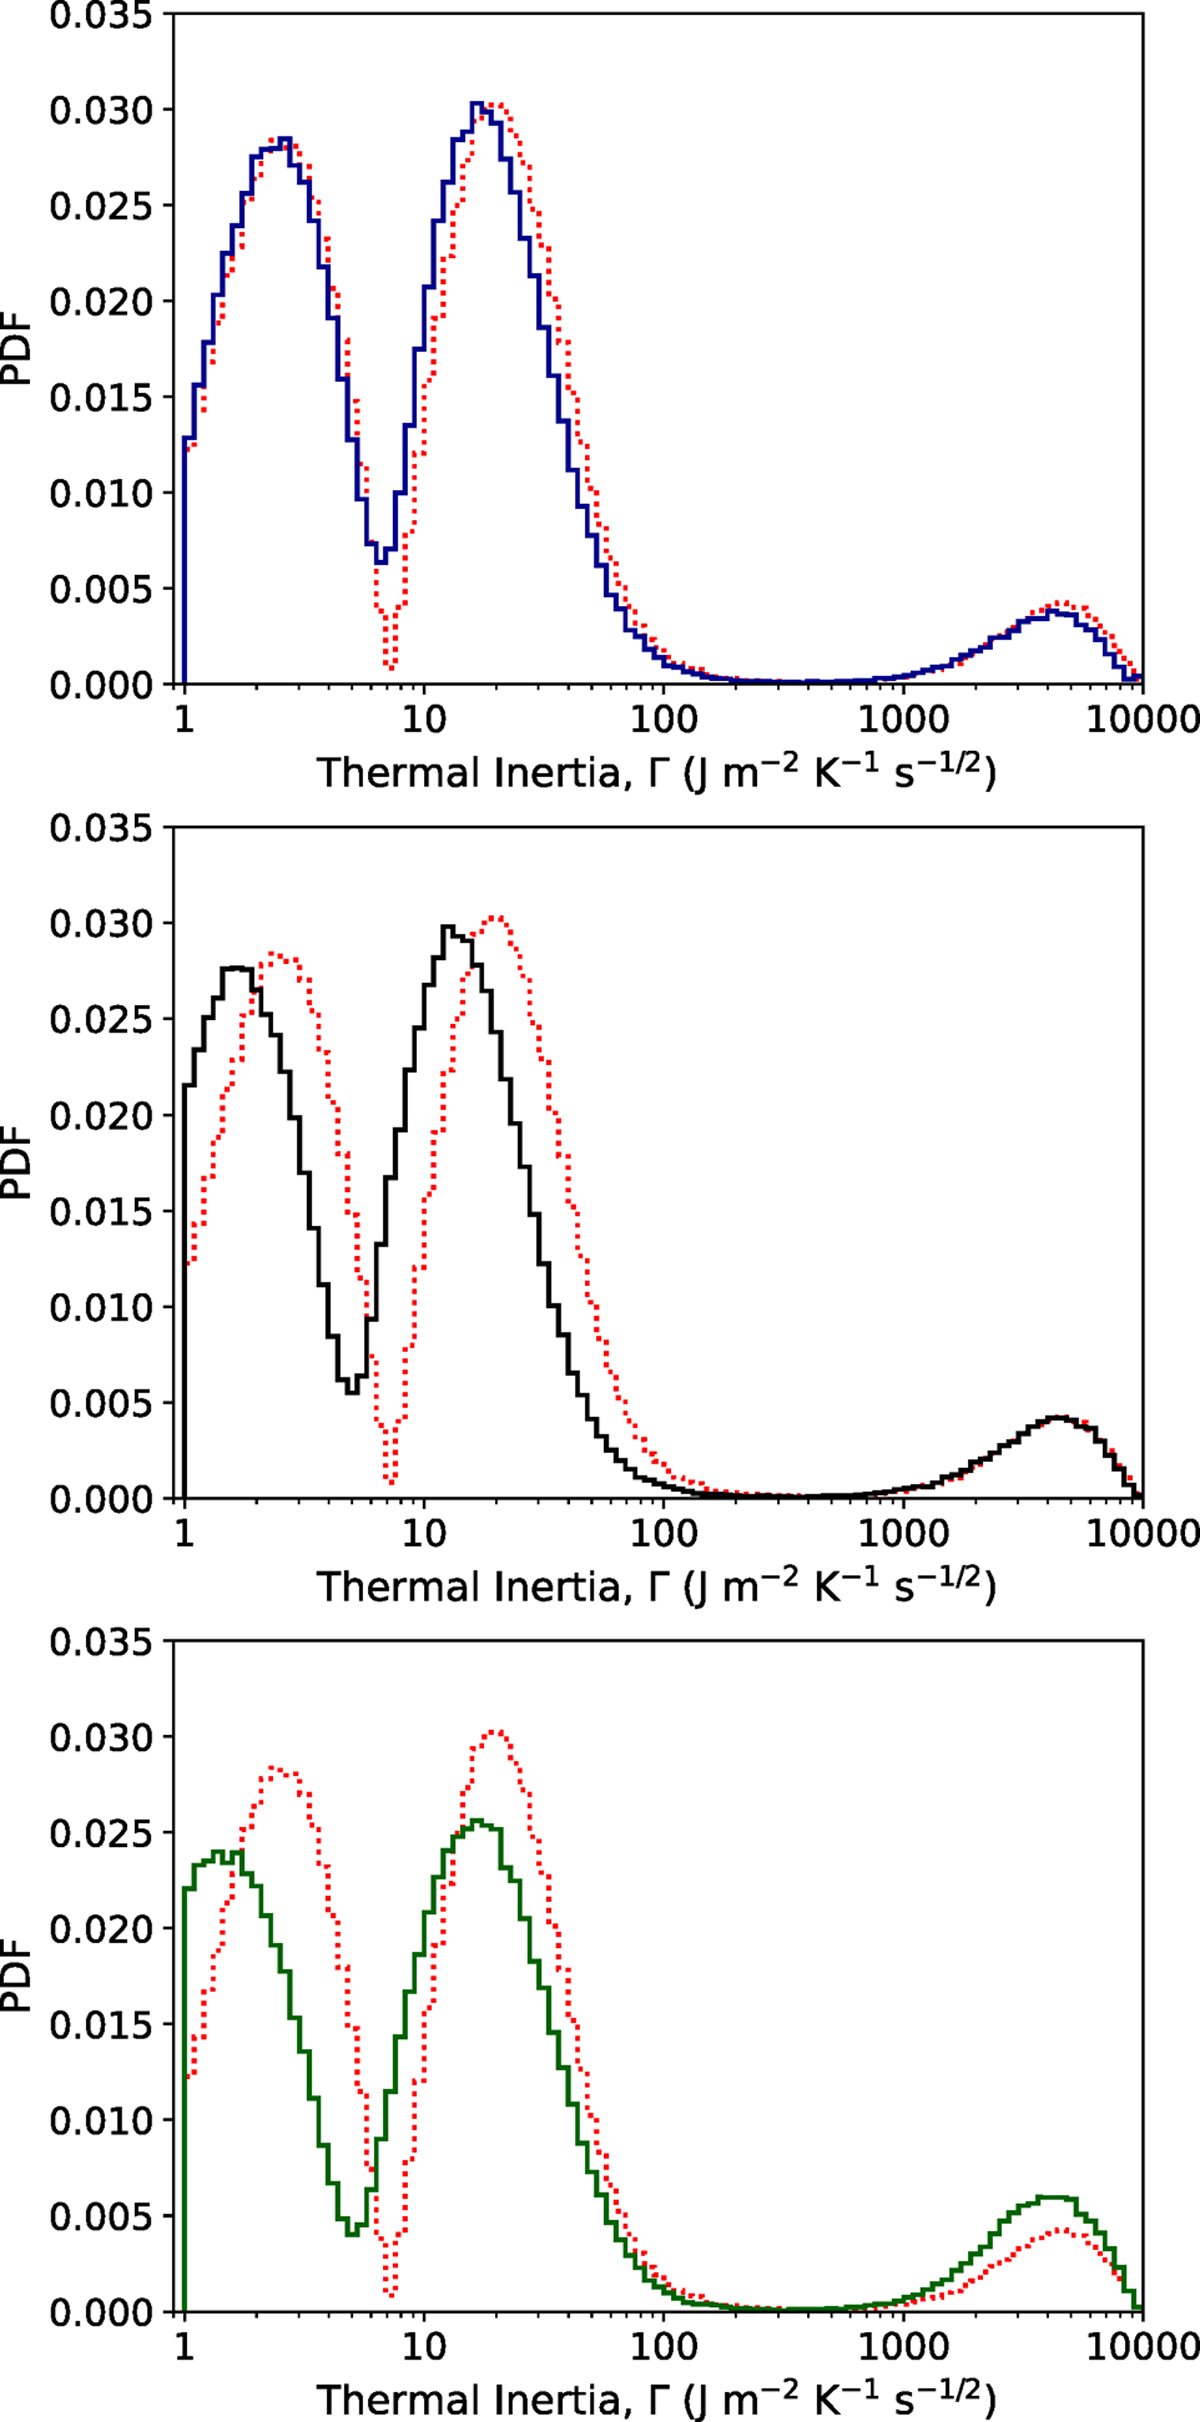
Dependence of the resulting thermal inertia estimation on the input parameters: comparison with the nominal results. As a guide, in each plot, the results of our nominal estimation are shown as a dotted red histogram. The top panel shows the obtained thermal inertia distribution when the absorption coefficient, α, is set to 0.9 (blue histogram). The middle panel shows the results obtained assuming an emissivity, ε, of 0.9 (black histogram). The bottom panel shows how the thermal inertia distribution changes when a uniform input distribution of density, ρ, is assumed (green histogram).
Current usage metrics show cumulative count of Article Views (full-text article views including HTML views, PDF and ePub downloads, according to the available data) and Abstracts Views on Vision4Press platform.
Data correspond to usage on the plateform after 2015. The current usage metrics is available 48-96 hours after online publication and is updated daily on week days.
Initial download of the metrics may take a while.