Fig. 3
Download original image
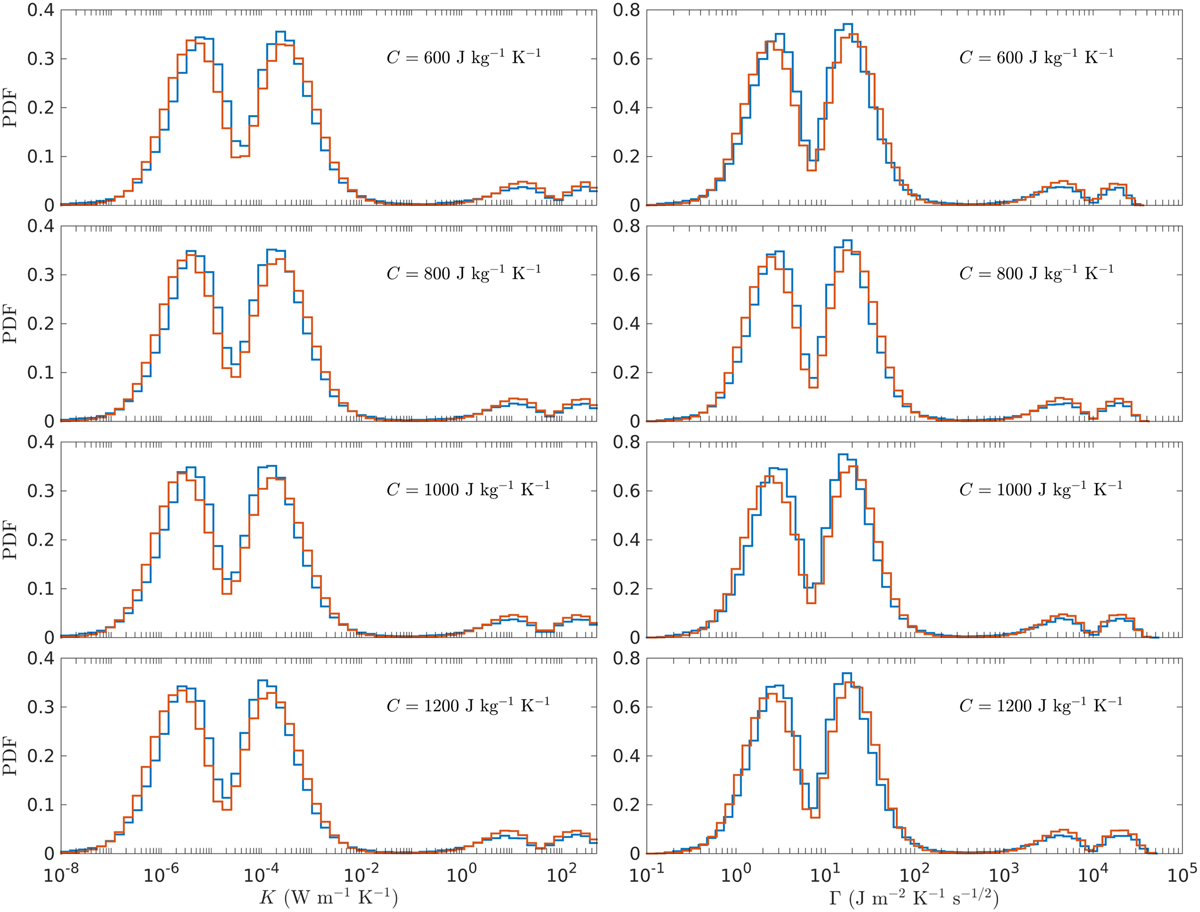
Distributions of the thermal parameters of 2016 GE1 for different values of heat capacity, C. The first column shows the distributions of the thermal conductivity, K, and the second column the distributions of the thermal inertia, Γ. Blue histograms are the results obtained using the orbital solution provided by the JPL SBDB, while red histograms are the results obtained using our solution obtained with OrbFit.
Current usage metrics show cumulative count of Article Views (full-text article views including HTML views, PDF and ePub downloads, according to the available data) and Abstracts Views on Vision4Press platform.
Data correspond to usage on the plateform after 2015. The current usage metrics is available 48-96 hours after online publication and is updated daily on week days.
Initial download of the metrics may take a while.