Fig. 2
Download original image
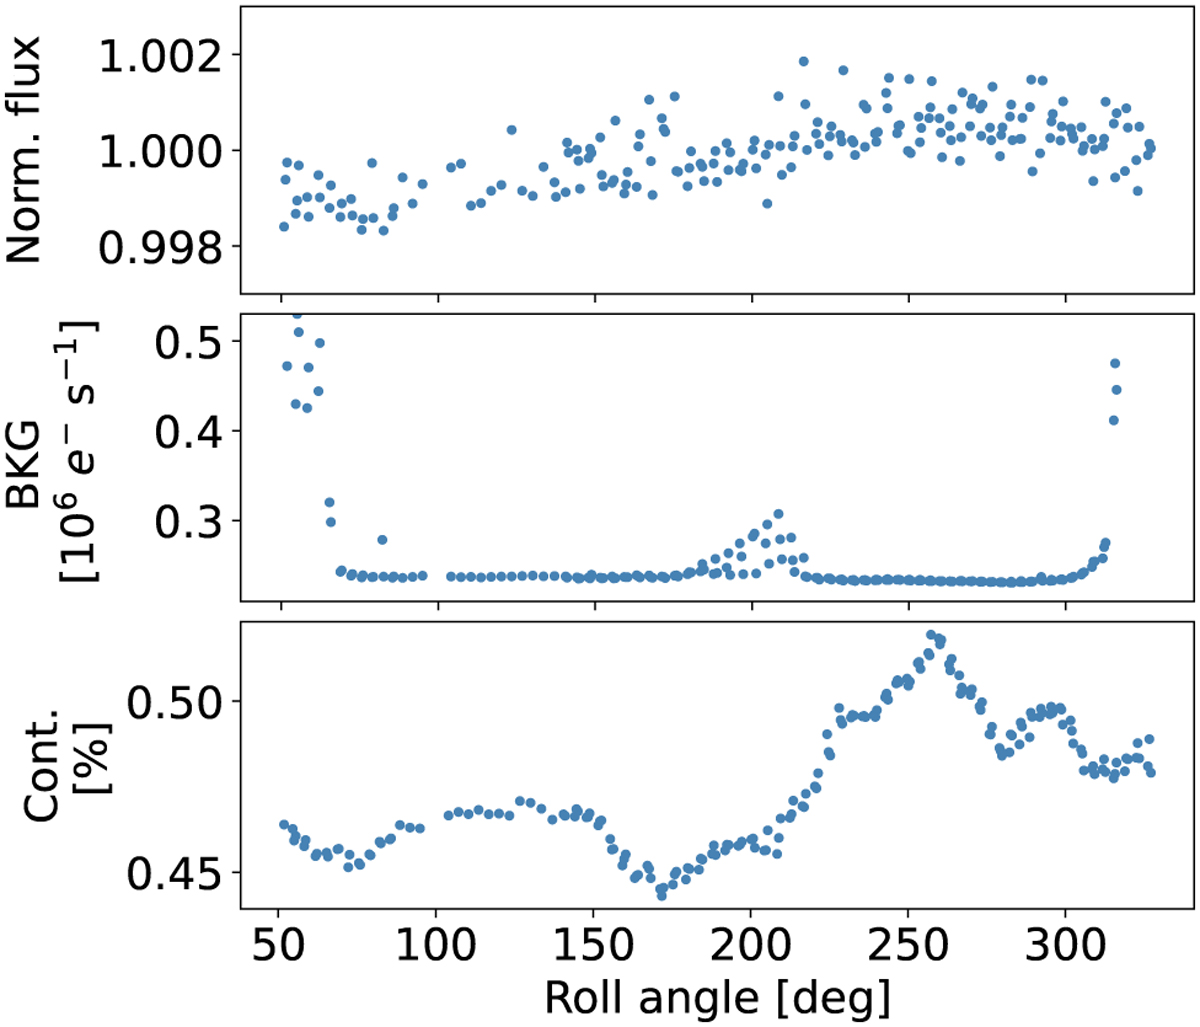
Example of the flux, background, and contamination curves of LTT 9779. The top panel shows the raw normalized flux (DEFAULT aperture) of CHEOPS visit 2 as a function of the roll angle. The corresponding curves of the background and contamination produced by nearby stars are shown in the middle and bottom panels, respectively.
Current usage metrics show cumulative count of Article Views (full-text article views including HTML views, PDF and ePub downloads, according to the available data) and Abstracts Views on Vision4Press platform.
Data correspond to usage on the plateform after 2015. The current usage metrics is available 48-96 hours after online publication and is updated daily on week days.
Initial download of the metrics may take a while.