Fig. D.2
Download original image
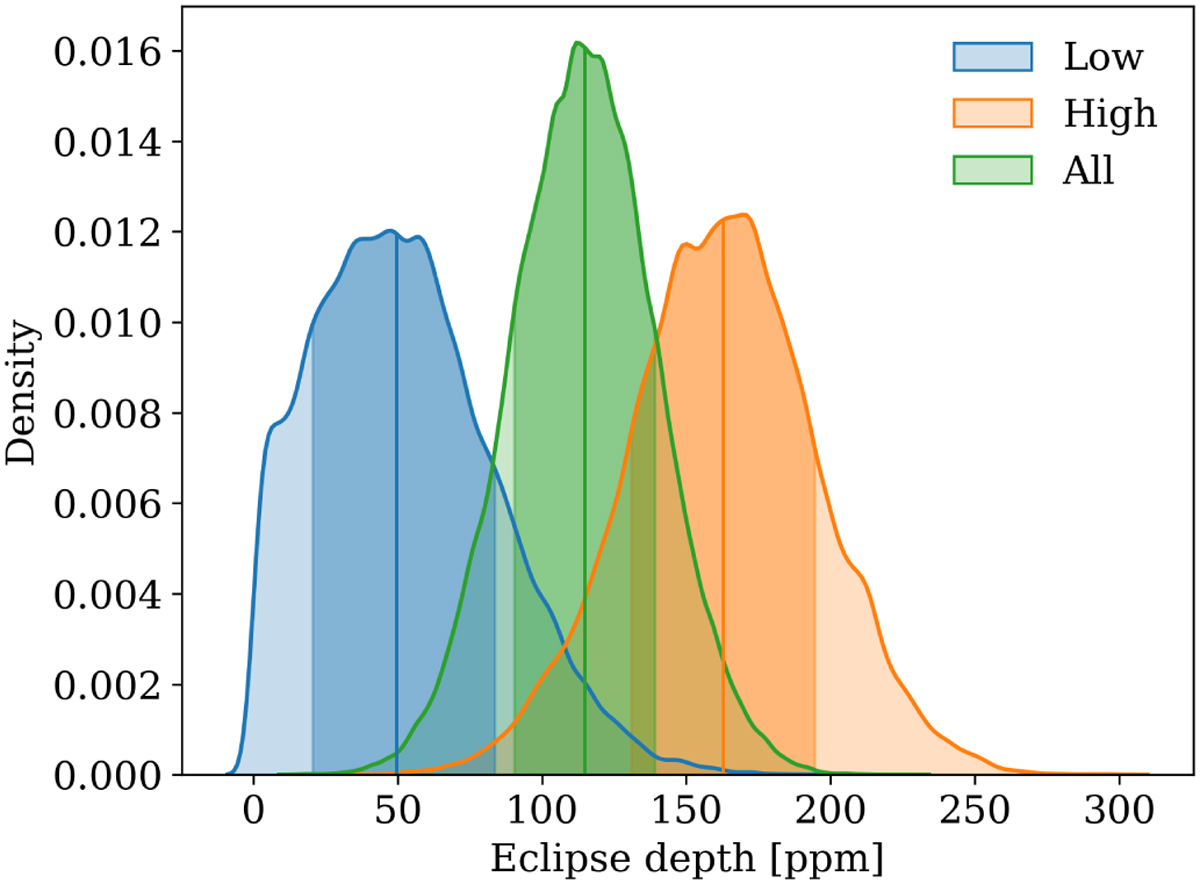
Density distributions of the MCMC walkers of the fitted eclipse depth. We show the distribution of the estimated depth using all the CHEOPS visits (green), and the visits with high (1, 2, 3, 4, 5, and 10; orange) and low (6, 7, 8, and 9; blue) depth estimates are shown. The vertical lines and shaded areas represent the median and the 1σ intervals.
Current usage metrics show cumulative count of Article Views (full-text article views including HTML views, PDF and ePub downloads, according to the available data) and Abstracts Views on Vision4Press platform.
Data correspond to usage on the plateform after 2015. The current usage metrics is available 48-96 hours after online publication and is updated daily on week days.
Initial download of the metrics may take a while.