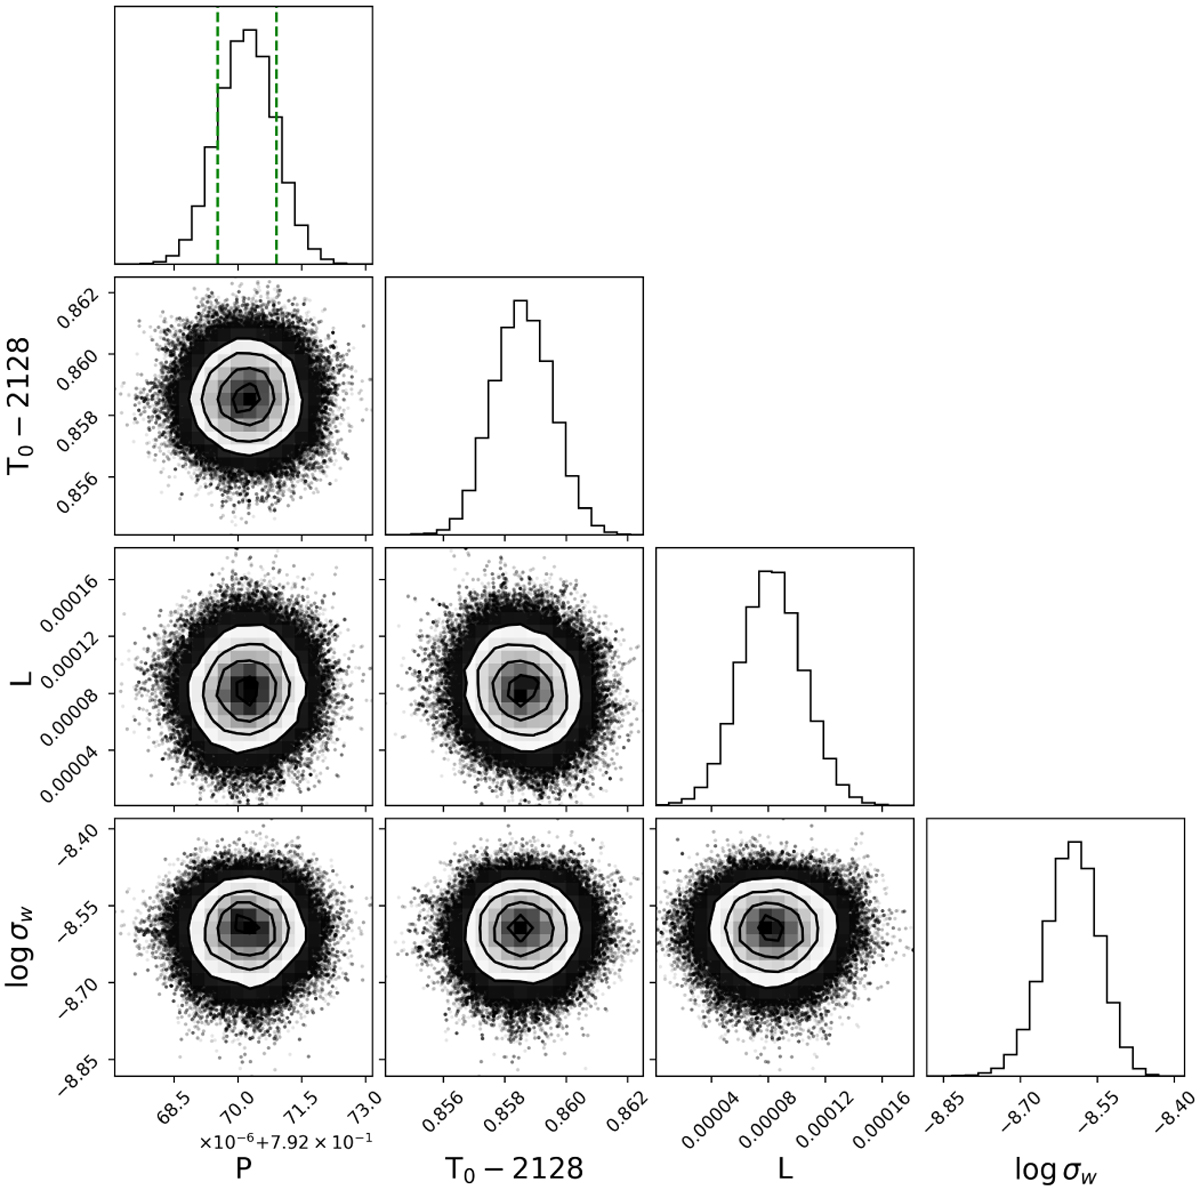
Fig. C.1
Download original image
Corner plot of relevant parameters of the multivisit fit. The posterior distributions of all the modeled parameters have Gaussianlike shapes. For visualization purposes, we only show the distributions of the orbital period (P), the mean time of the transits (T_0), the eclipse depth (L), and the white-noise component in its log form (log σW).
Current usage metrics show cumulative count of Article Views (full-text article views including HTML views, PDF and ePub downloads, according to the available data) and Abstracts Views on Vision4Press platform.
Data correspond to usage on the plateform after 2015. The current usage metrics is available 48-96 hours after online publication and is updated daily on week days.
Initial download of the metrics may take a while.