Fig. A.1
Download original image
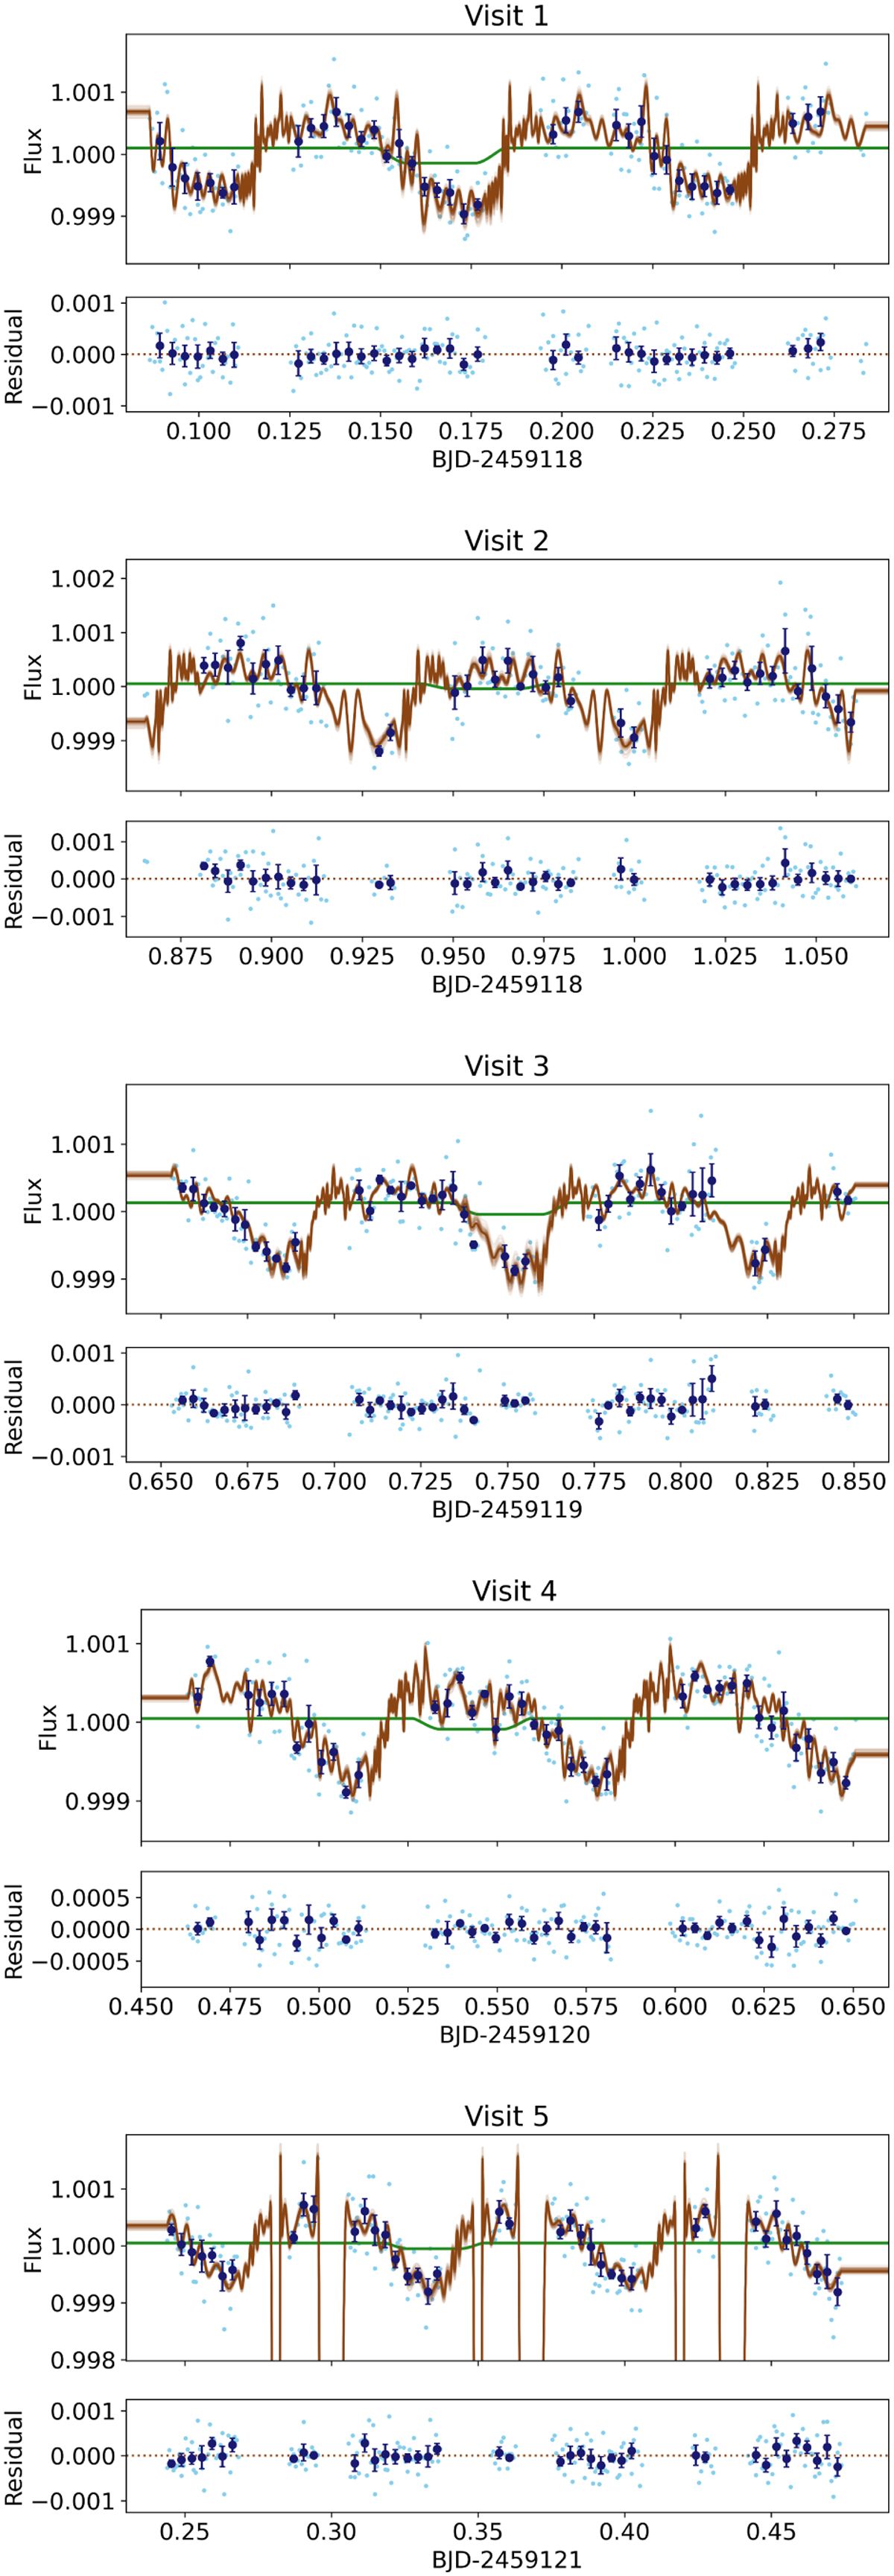
CHEOPS raw light curves of the eclipses of LTT 9779 bfor visits 1, 2, 3, 4 and 5. The normalized photometric points (after sigma clipping) and the 5 min bins correspond to the light and dark blue symbols, respectively. The detrending (green curves) and best eclipse model (brown curve) are overplotted. The fit residuals are shown at the bottom of each light-curve panel.
Current usage metrics show cumulative count of Article Views (full-text article views including HTML views, PDF and ePub downloads, according to the available data) and Abstracts Views on Vision4Press platform.
Data correspond to usage on the plateform after 2015. The current usage metrics is available 48-96 hours after online publication and is updated daily on week days.
Initial download of the metrics may take a while.