Fig. 9
Download original image
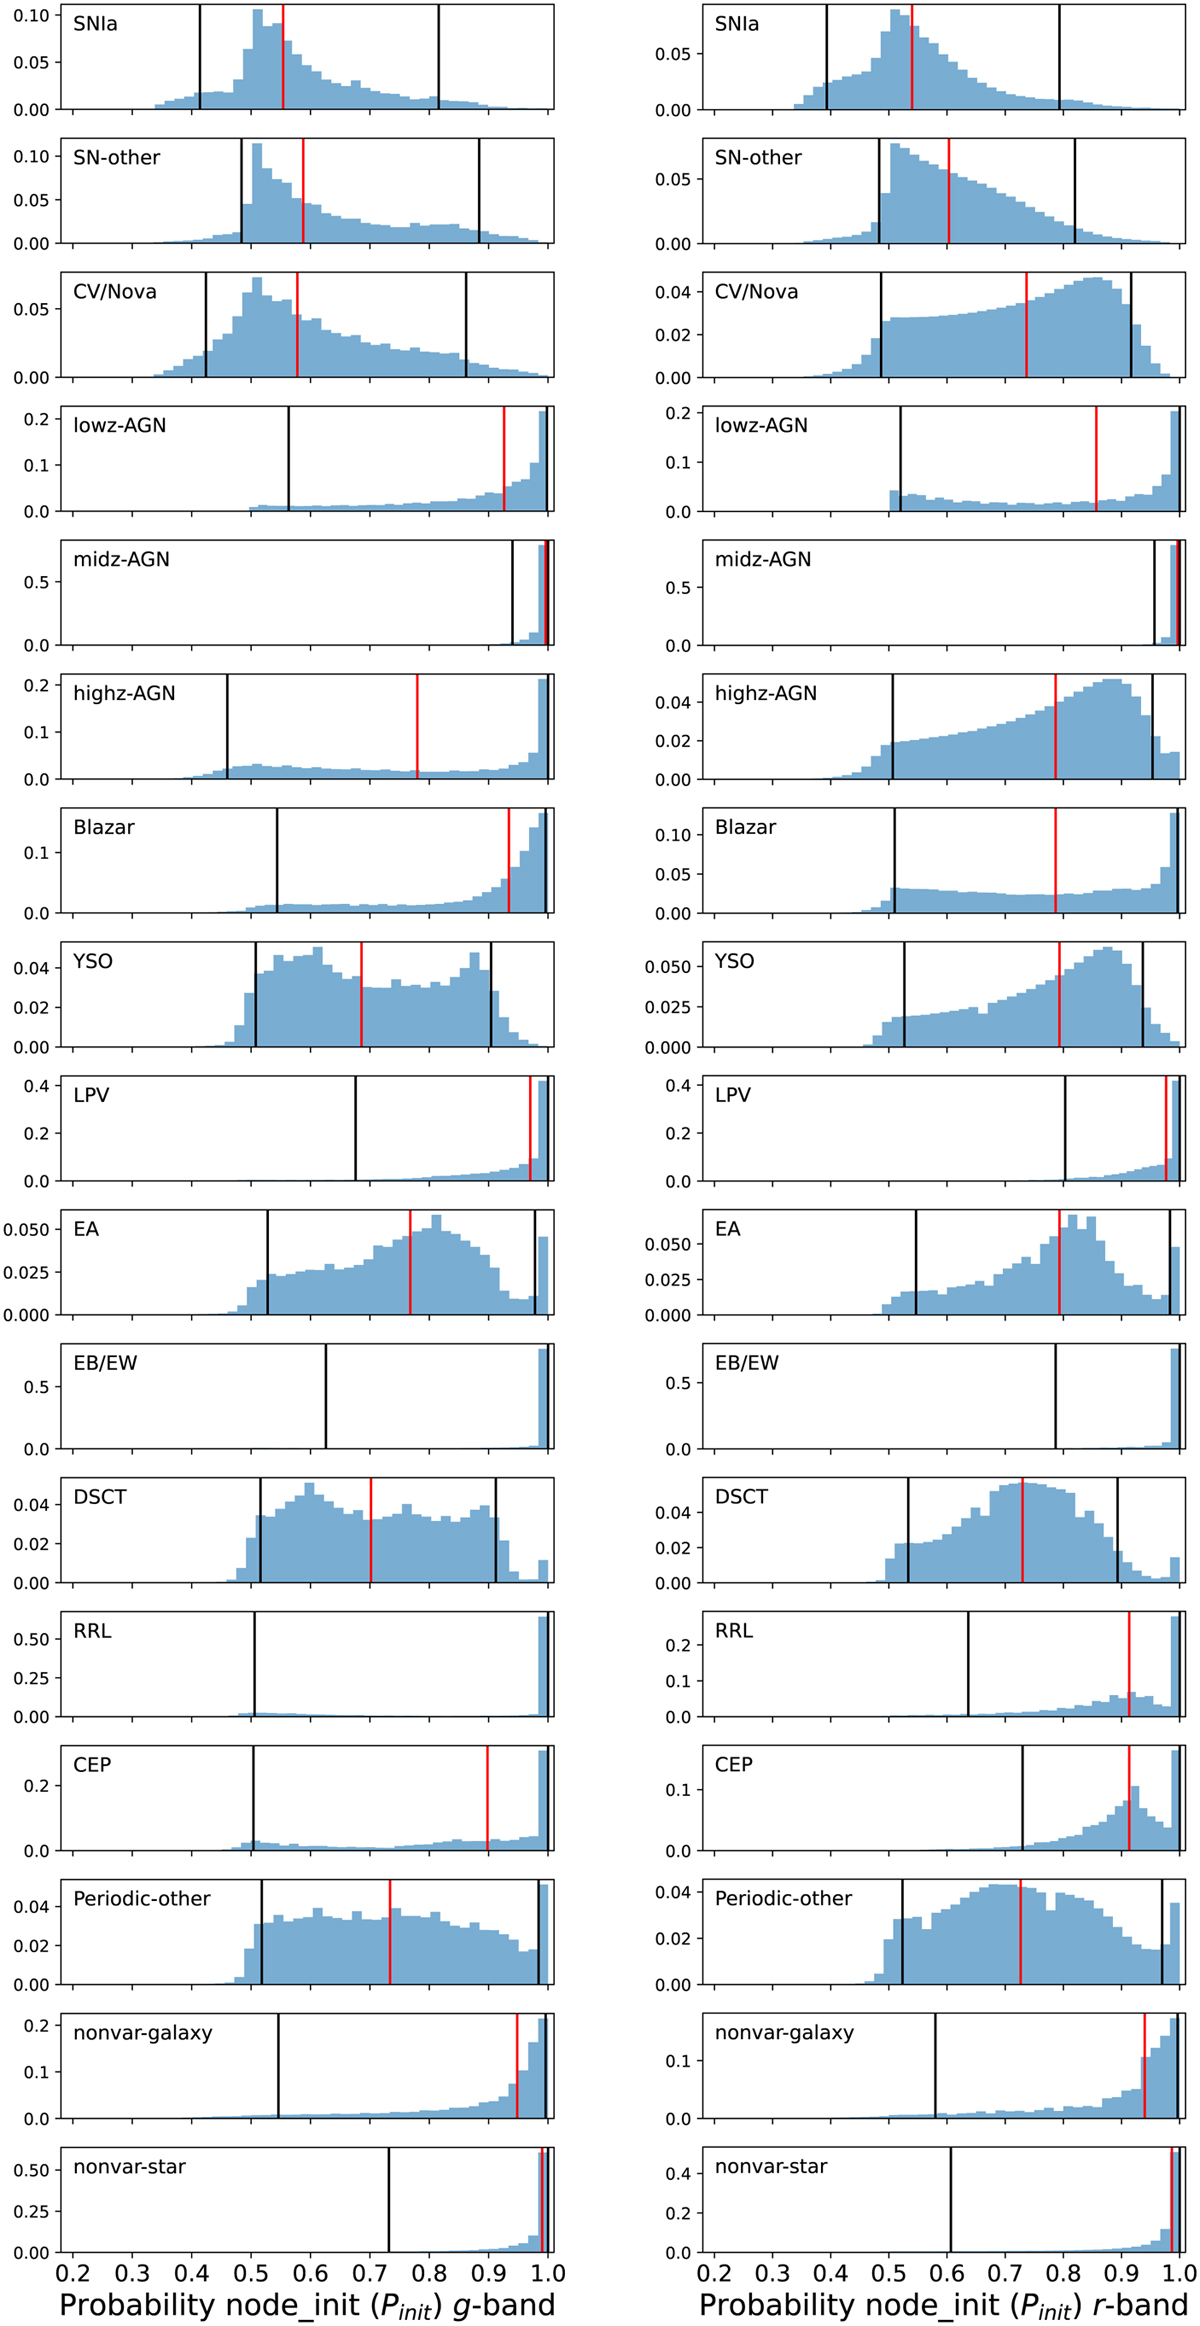
Normalized probability distributions of the node_init (Pinit) for the 17 classes considered in this work. The results for the g band are shown in the left panel, and for the r band in the right panel. The red lines show the median probability for each class. The black lines show the 5th and 95th percentiles of the probabilities.
Current usage metrics show cumulative count of Article Views (full-text article views including HTML views, PDF and ePub downloads, according to the available data) and Abstracts Views on Vision4Press platform.
Data correspond to usage on the plateform after 2015. The current usage metrics is available 48-96 hours after online publication and is updated daily on week days.
Initial download of the metrics may take a while.