Fig. 5
Download original image
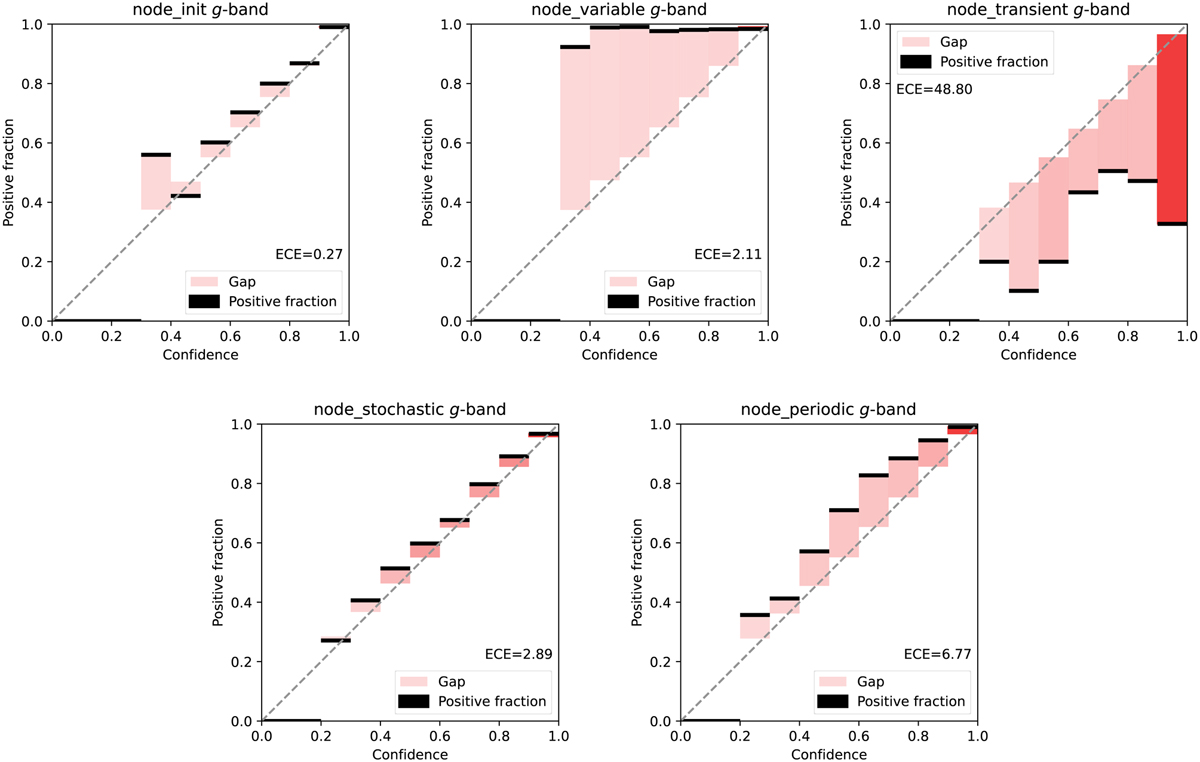
Reliability diagrams for each node of the g-band HBRF classifier. We plot the PF (shown in black) and the gap (in red) versus the confidence. The transparency of the gap represents how much each bin contributes to the ECE score (less transparent for bins with more samples). The identity function is shown as a reference. The ECE score is shown next to the legend for each node.
Current usage metrics show cumulative count of Article Views (full-text article views including HTML views, PDF and ePub downloads, according to the available data) and Abstracts Views on Vision4Press platform.
Data correspond to usage on the plateform after 2015. The current usage metrics is available 48-96 hours after online publication and is updated daily on week days.
Initial download of the metrics may take a while.