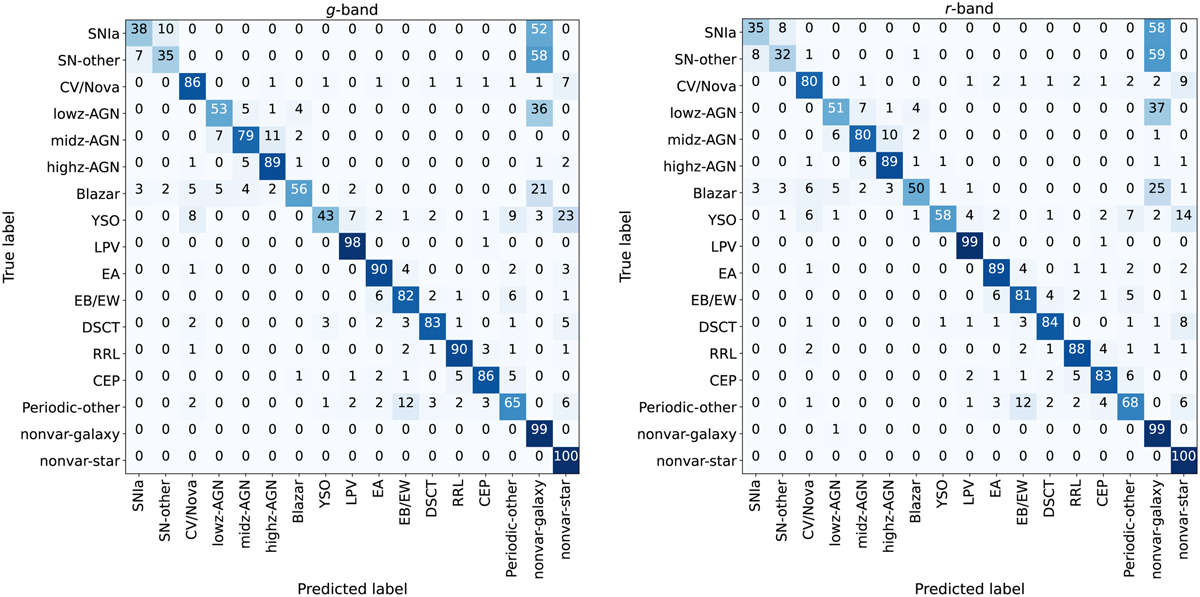
Fig. 4
Download original image
Confusion matrices of the final 17 classes obtained by using the HBRF in the testing set. The matrix for the g band is shown in the left panel, and for the r band in the right panel. To normalize the confusion matrix results as percentages, we divided each row by the total number of objects per class with known labels, and we rounded these percentages to integer values.
Current usage metrics show cumulative count of Article Views (full-text article views including HTML views, PDF and ePub downloads, according to the available data) and Abstracts Views on Vision4Press platform.
Data correspond to usage on the plateform after 2015. The current usage metrics is available 48-96 hours after online publication and is updated daily on week days.
Initial download of the metrics may take a while.