Fig. 2
Download original image
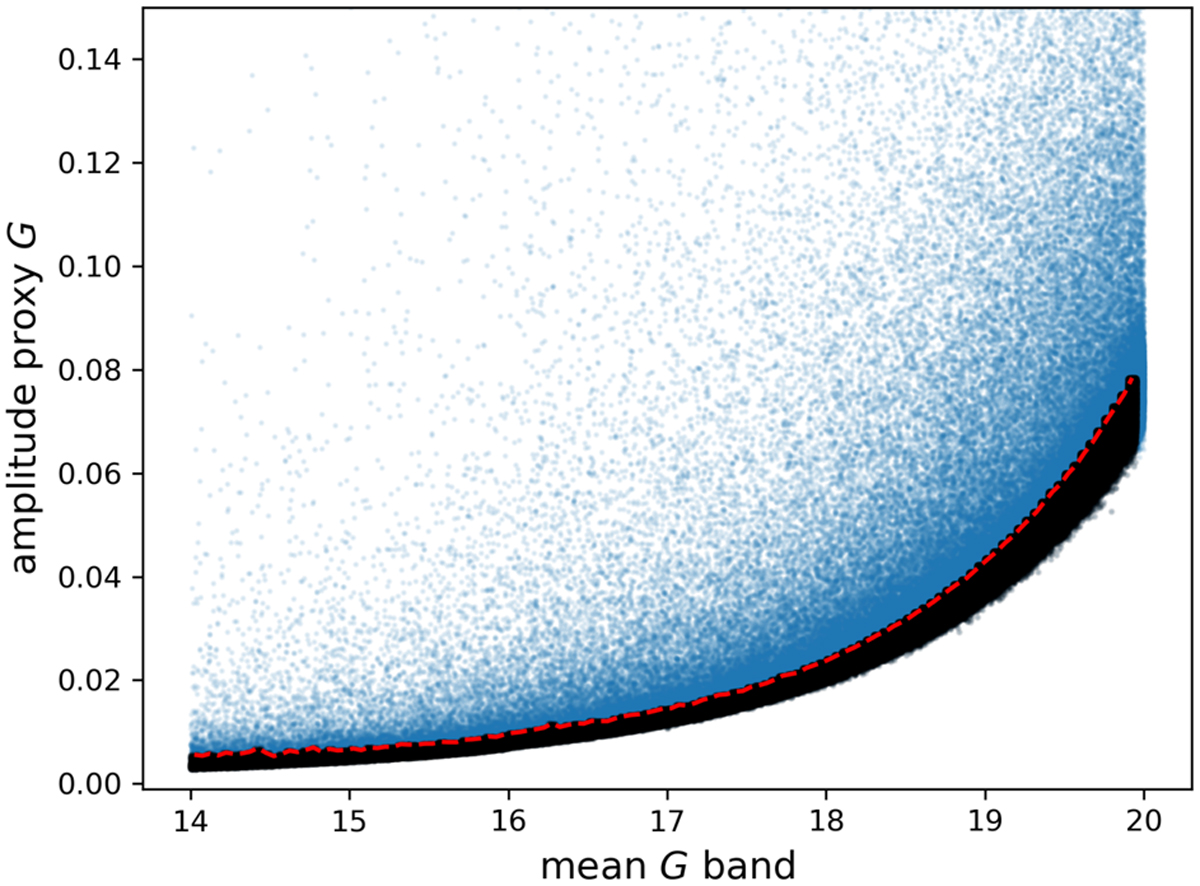
Amplitude proxy in the Gaia g-band magnitude versus the mean g-band magnitude for a sample of potential non-variable stars. In blue we show the sources that are removed from the sample, and in black the sources included in the final sample of non-variable stars. The dashed red line shows the mean Aproxy per bin of magnitude in the g band (Amean).
Current usage metrics show cumulative count of Article Views (full-text article views including HTML views, PDF and ePub downloads, according to the available data) and Abstracts Views on Vision4Press platform.
Data correspond to usage on the plateform after 2015. The current usage metrics is available 48-96 hours after online publication and is updated daily on week days.
Initial download of the metrics may take a while.