Fig. 19
Download original image
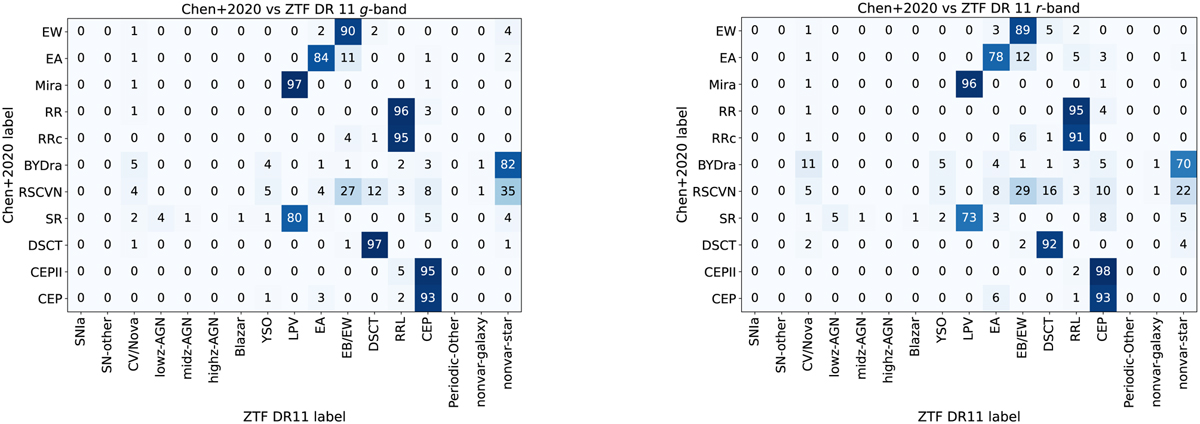
Comparison of the classifications obtained by Chen et al. (2020), using ZTF DR2, and the classifications obtained by our model for the ZTF DR 11 light curves. The left panel shows the results when the g-band features are used for the DR classifier, the right panel shows the results when the r-band features are used for the DR classifier. We divided each row by the total number of objects per class with Chen et al. (2020) labels, and we rounded these percentages to integer values.
Current usage metrics show cumulative count of Article Views (full-text article views including HTML views, PDF and ePub downloads, according to the available data) and Abstracts Views on Vision4Press platform.
Data correspond to usage on the plateform after 2015. The current usage metrics is available 48-96 hours after online publication and is updated daily on week days.
Initial download of the metrics may take a while.