Fig. 15
Download original image
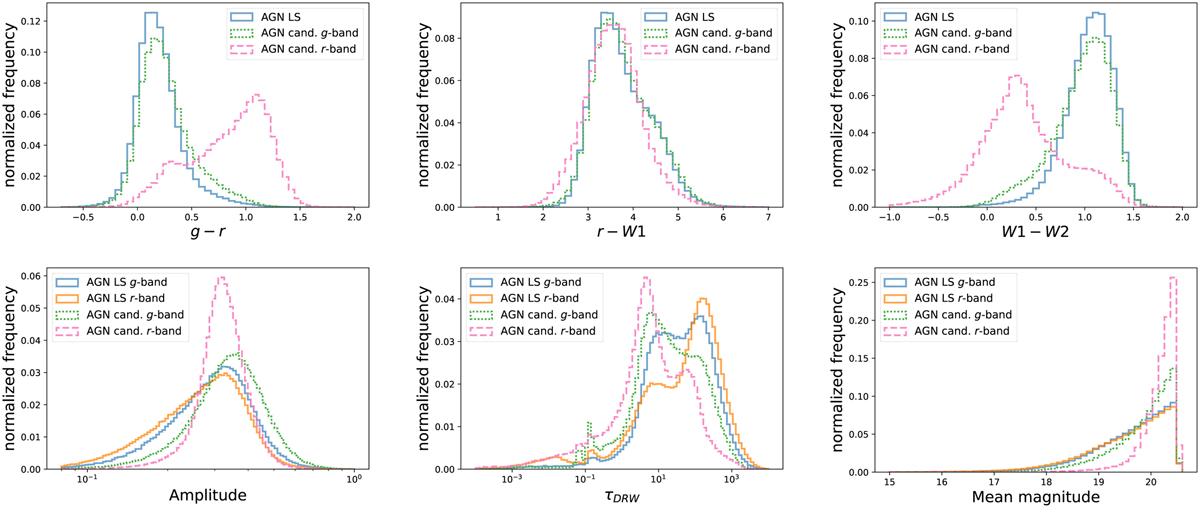
Feature distributions of AGN candidates and AGN from the LS. Top panels: g – r (left), r – W1 (center), and W1 – W2 (right) color distributions of AGN from the LS (blue), AGN candidates selected from the g band (green), and AGN candidates selected from the r band (pink). Bottom panels: Amplitude (left), GP_DRW_tau (timescale of the DRW model, center), and mean magnitude (right), for AGN from the LS in the g band (blue), AGN from the LS in the r band (yellow), AGN candidates selected from the g band (green), and AGN candidates selected from the r band (pink).
Current usage metrics show cumulative count of Article Views (full-text article views including HTML views, PDF and ePub downloads, according to the available data) and Abstracts Views on Vision4Press platform.
Data correspond to usage on the plateform after 2015. The current usage metrics is available 48-96 hours after online publication and is updated daily on week days.
Initial download of the metrics may take a while.