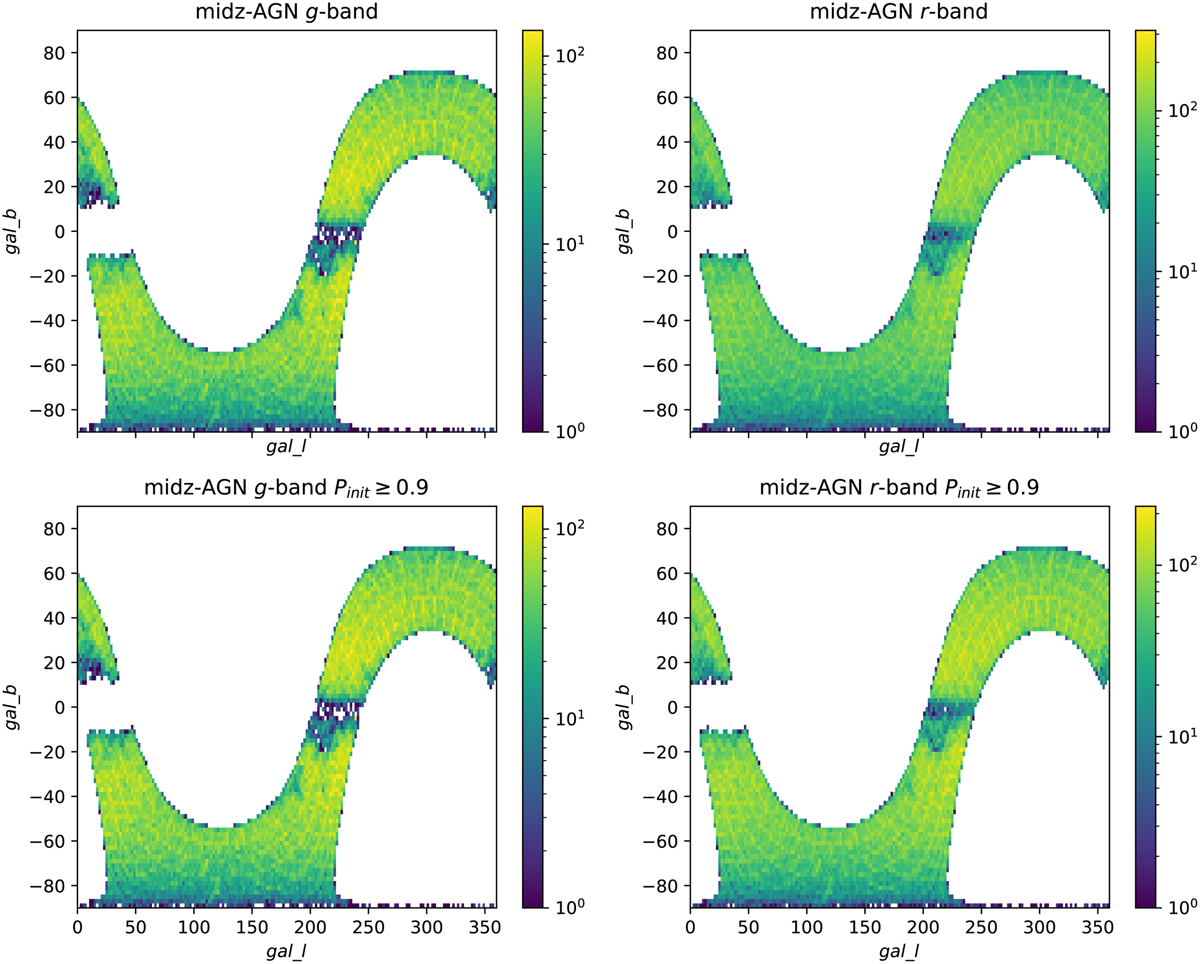
Fig. 11
Download original image
Number of targets (see the color bars) per 4 deg2 for the midz-AGN class, in Galactic coordinates. The upper panels show the densities for all the selected candidates in the g band (upper left) and the r band (upper right). The bottom panels show the densities for candidates with large probability in the node_init (Pinit ≥ 0.9) for the g band (bottom left) and the r band (bottom right). Note that the range of the number of targets covered by each color bar can differ in each panel.
Current usage metrics show cumulative count of Article Views (full-text article views including HTML views, PDF and ePub downloads, according to the available data) and Abstracts Views on Vision4Press platform.
Data correspond to usage on the plateform after 2015. The current usage metrics is available 48-96 hours after online publication and is updated daily on week days.
Initial download of the metrics may take a while.