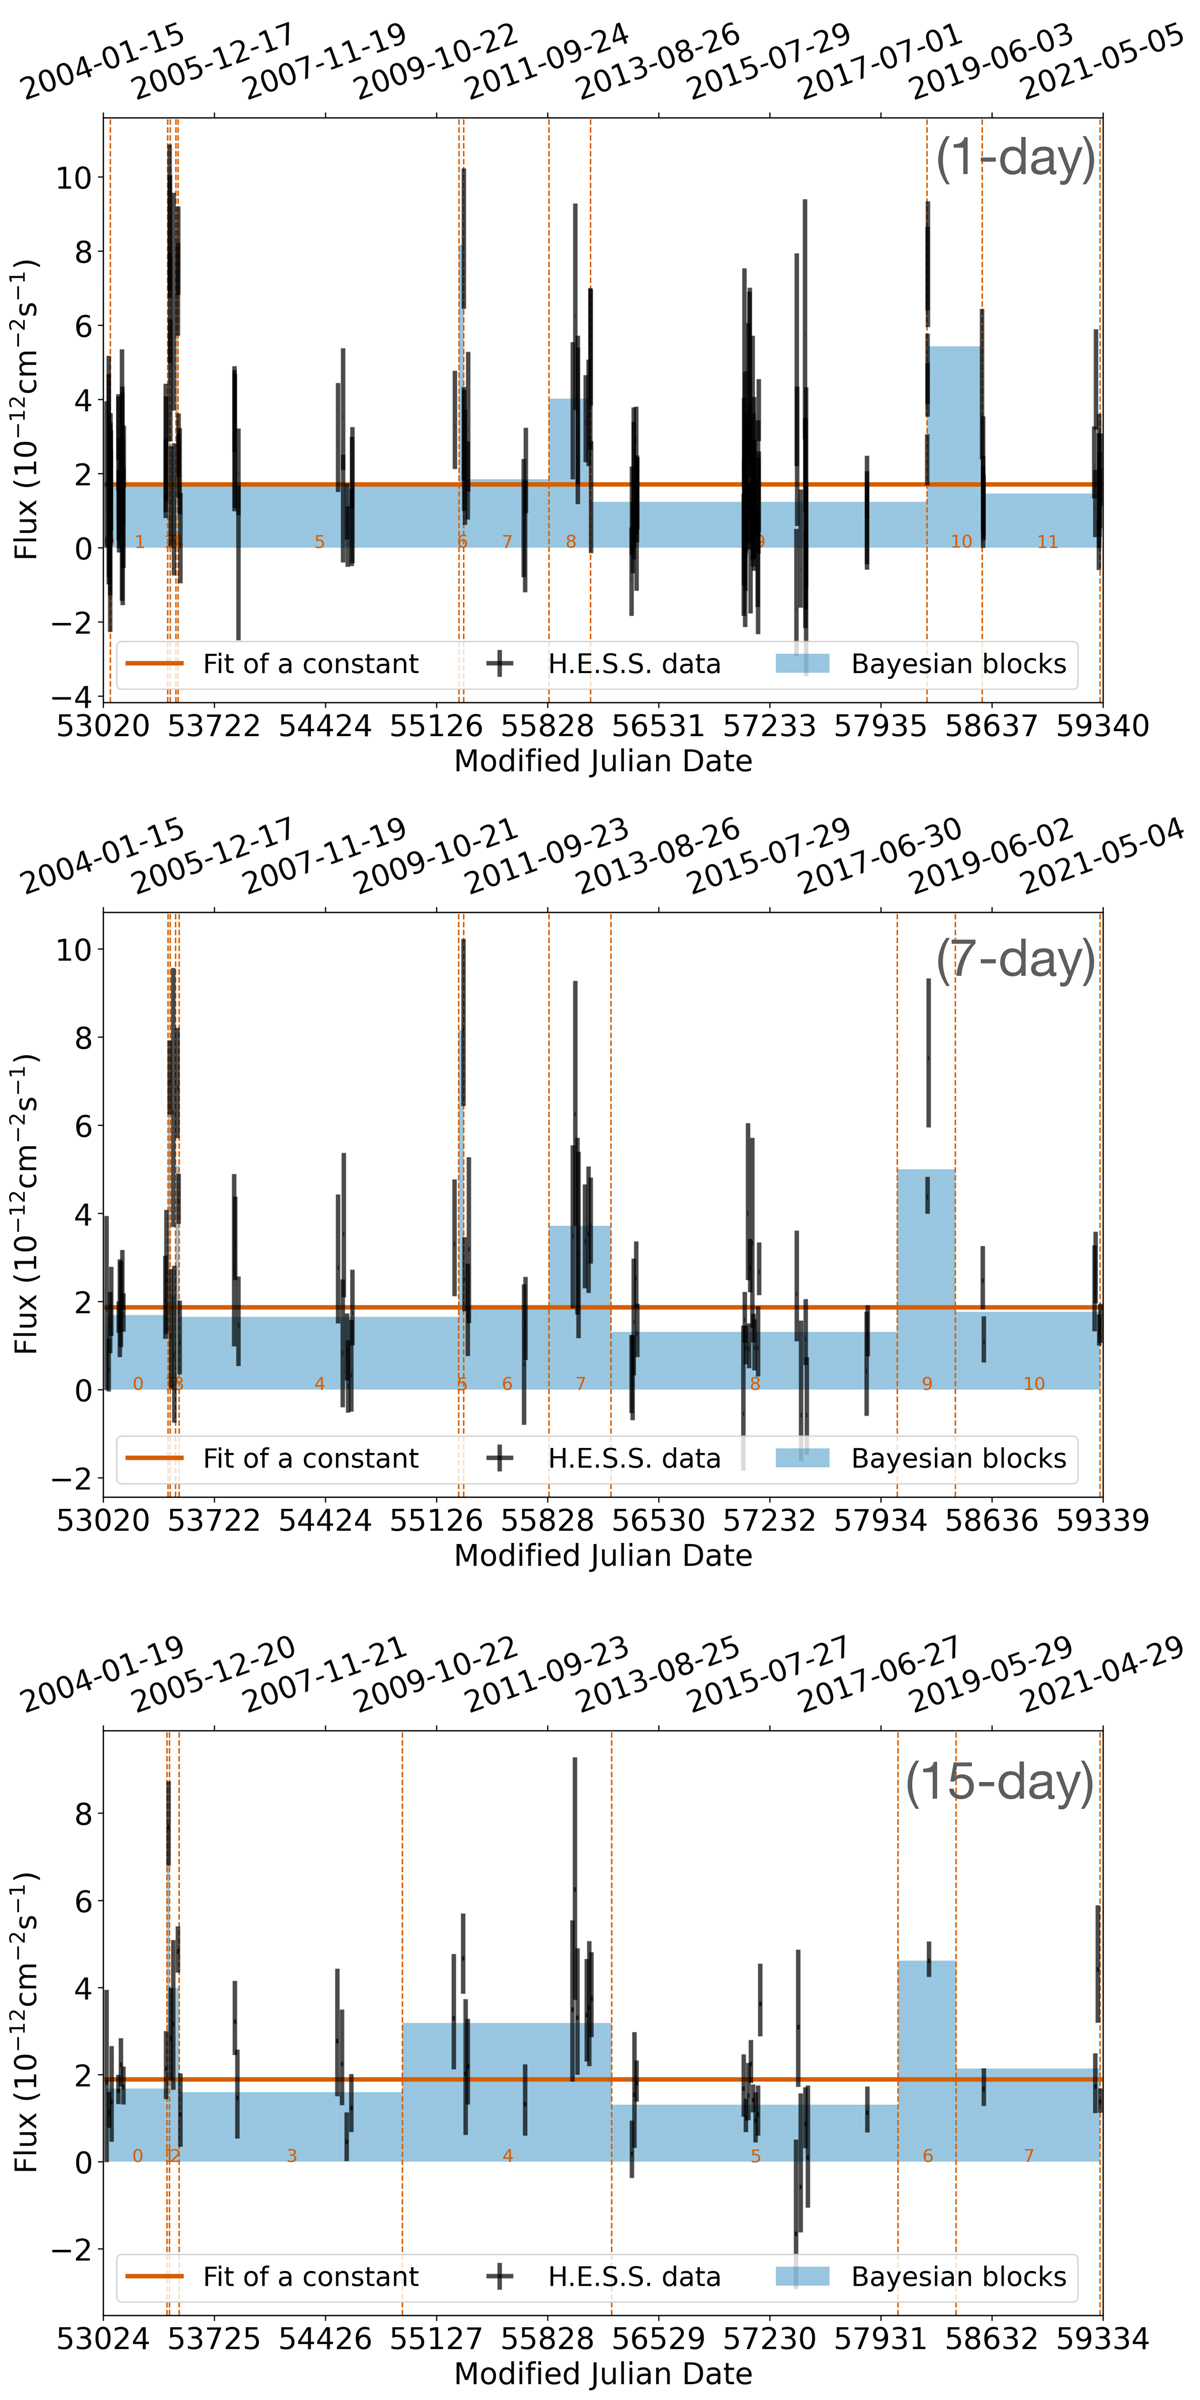
Fig. A.1.
Download original image
M 87 long-term light curves with their Bayesian blocks derived according to Sect. 2.2 for 1-day- (top), 7-day- (middle), and 15-day-binned flux points (bottom). The H.E.S.S. data points are shown in black, and a constant fit is shown with the solid orange line. The blocks with their flux levels are given by the blue rectangles. Dashed orange lines indicate a change in the flux level. The orange numbers at the bottom indicate the labels of the blocks.
Current usage metrics show cumulative count of Article Views (full-text article views including HTML views, PDF and ePub downloads, according to the available data) and Abstracts Views on Vision4Press platform.
Data correspond to usage on the plateform after 2015. The current usage metrics is available 48-96 hours after online publication and is updated daily on week days.
Initial download of the metrics may take a while.