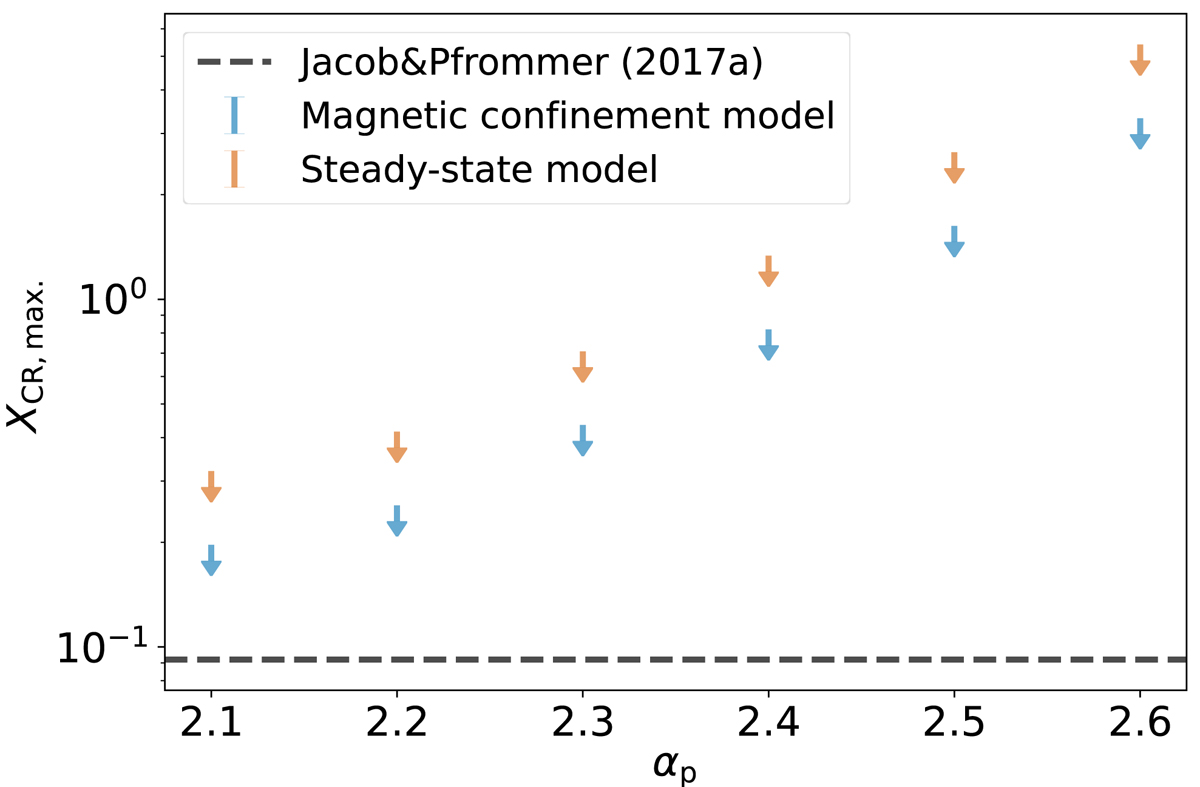
Fig. 4.
Download original image
UL of the maximum CR to thermal pressure ratio, XCR, max. = max(PCR(r)/Pth.(r)), within the inner 20 kpc of the cluster for different proton spectral indices. Two different CRp spatial distributions were considered for a set of CRp spectral indices. The blue ULs are the result of the magnetic confinement approach (Sect. 4.2), and the orange ULs are the result of the steady-state approach (Sect. 4.3). The prediction by Jacob & Pfrommer (2017a) is also shown, in dashed black.
Current usage metrics show cumulative count of Article Views (full-text article views including HTML views, PDF and ePub downloads, according to the available data) and Abstracts Views on Vision4Press platform.
Data correspond to usage on the plateform after 2015. The current usage metrics is available 48-96 hours after online publication and is updated daily on week days.
Initial download of the metrics may take a while.