Fig. 2.
Download original image
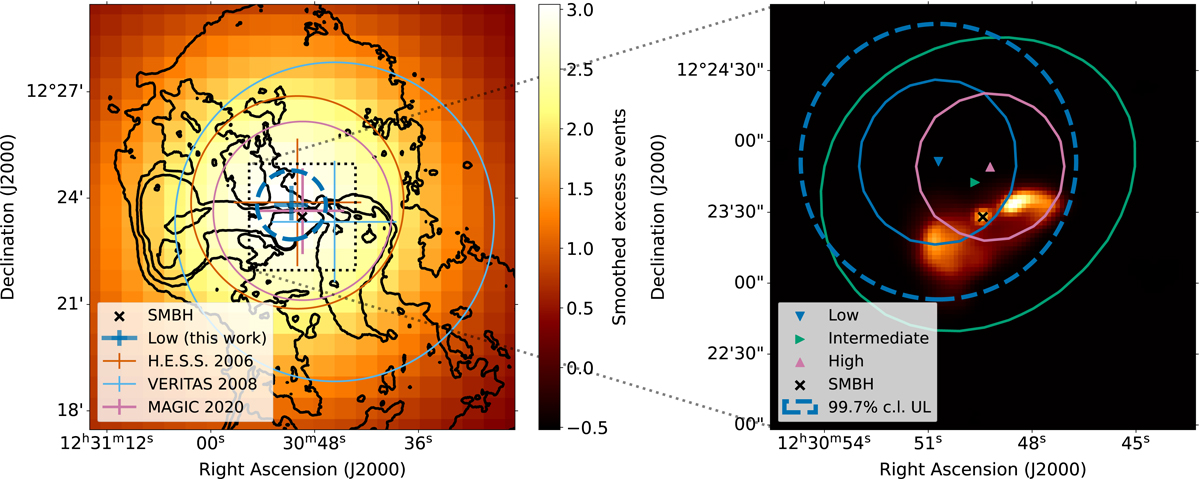
Results of the morphology fit in comparison to the shape of the radio emission and previous results. Left: H.E.S.S. low-state excess counts map with the derived extension UL plotted alongside previous ULs and the radio contour from the VLA 90 cm map (Thopson et al. 1980; Owen et al. 2000). The H.E.S.S. map is smoothed with a rotationally symmetric 2D Gaussian function with σG = 18″ for better visualization. The best-fit position is shown by the blue marker for the Gaussian model, with its σG extension UL at the 99.7% c.l given by the dashed dark blue circle. The blue error bars in the position include the 1σ statistical uncertainty from the fit and 20″ systematic uncertainty (Acero et al. 2010). Previous results by H.E.S.S. (Aharonian et al. 2006a), VERITAS (Acciari et al. 2008), and MAGIC (MAGIC Collaboration 2020) are shown with the orange, light blue, and purple circles, respectively. The radio core of M 87 is marked by the black cross (Massaro et al. 2013). The dotted black square indicates the region depicted in the right figure. Right: The VLA 21 cm (Becker et al. 1995; The FIRST Project Team 1994) radio map of M 87 with the best-fit position for the point-like model for low, intermediate, and high flux states, shown with the blue, green, and pink triangles, respectively. The solid line contours represent 3σ statistical uncertainties for the respective source states. The dashed blue circle shows the resulting 99.7% c.l. of the Gaussian σG extension UL in the low state. The best-fit positions of the source states are consistent with one another and with the M 87 radio core, and they agree with previous results.
Current usage metrics show cumulative count of Article Views (full-text article views including HTML views, PDF and ePub downloads, according to the available data) and Abstracts Views on Vision4Press platform.
Data correspond to usage on the plateform after 2015. The current usage metrics is available 48-96 hours after online publication and is updated daily on week days.
Initial download of the metrics may take a while.