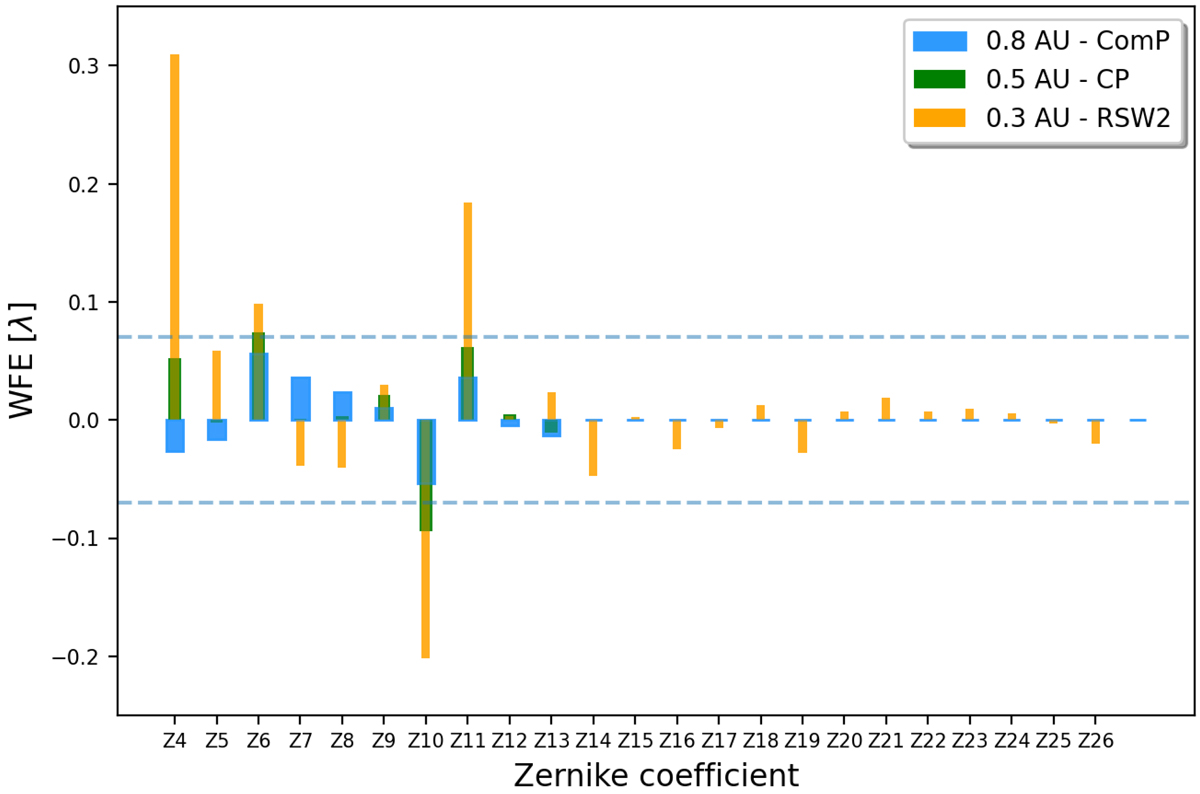
Fig. 3.
Download original image
Zernike coefficient distribution as deduced from the analysis of the PD datasets for each orbit. The dashed blue lines indicate the rms WFE values (±λ/14), which correspond to a diffraction-limited performance.
Current usage metrics show cumulative count of Article Views (full-text article views including HTML views, PDF and ePub downloads, according to the available data) and Abstracts Views on Vision4Press platform.
Data correspond to usage on the plateform after 2015. The current usage metrics is available 48-96 hours after online publication and is updated daily on week days.
Initial download of the metrics may take a while.