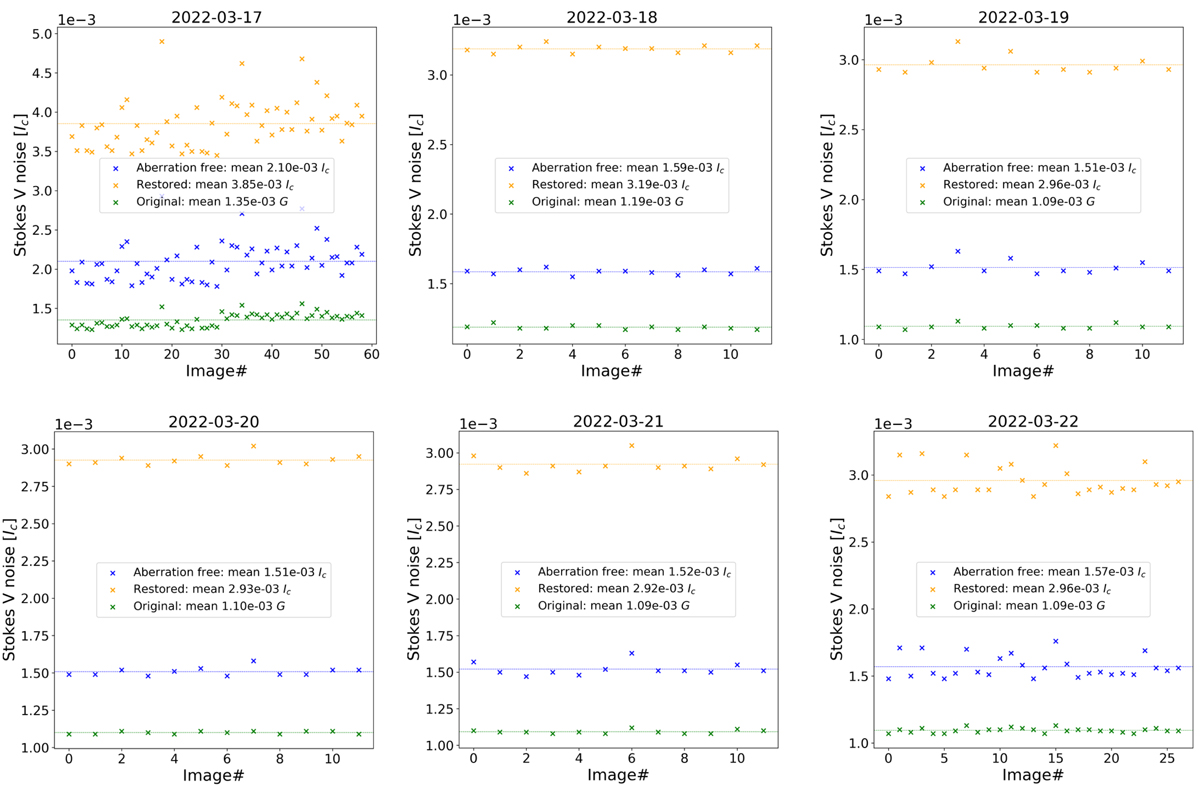
Fig. 14.
Download original image
Noise as measured in the Stokes V continuum of the HRT spectral line (in units of mean quiet-Sun intensity). The noise is measured in every dataset of the RSW2 observations and for the three data levels: L2 degraded data (green), restored with the interpolated PSF L2 data (orange), and aberration-corrected L2 data (blue). The box in each plot displays the computed mean of the measured noise over all daily observations.
Current usage metrics show cumulative count of Article Views (full-text article views including HTML views, PDF and ePub downloads, according to the available data) and Abstracts Views on Vision4Press platform.
Data correspond to usage on the plateform after 2015. The current usage metrics is available 48-96 hours after online publication and is updated daily on week days.
Initial download of the metrics may take a while.