Fig. 11.
Download original image
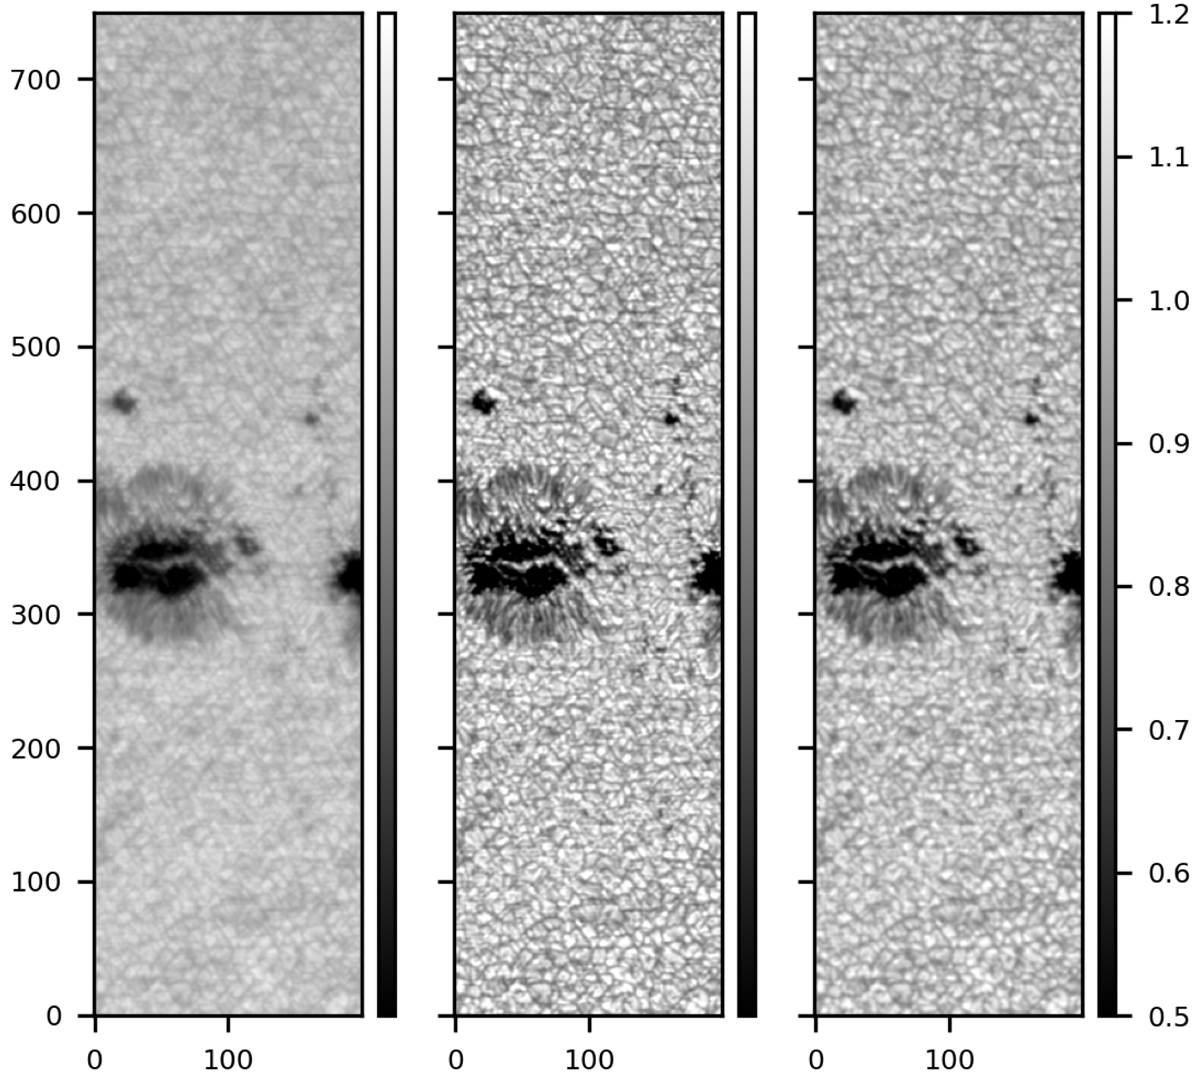
Results of the aberration correction. A subregion of an example dataset taken on 17 March 2022 at 03:18:09 UT (first panel). The restored area with the interpolated PSF (middle panel) and the aberration corrected area (last panel). The maps are taken in the continuum of the SO/PHI spectral line at 617.3 nm.
Current usage metrics show cumulative count of Article Views (full-text article views including HTML views, PDF and ePub downloads, according to the available data) and Abstracts Views on Vision4Press platform.
Data correspond to usage on the plateform after 2015. The current usage metrics is available 48-96 hours after online publication and is updated daily on week days.
Initial download of the metrics may take a while.