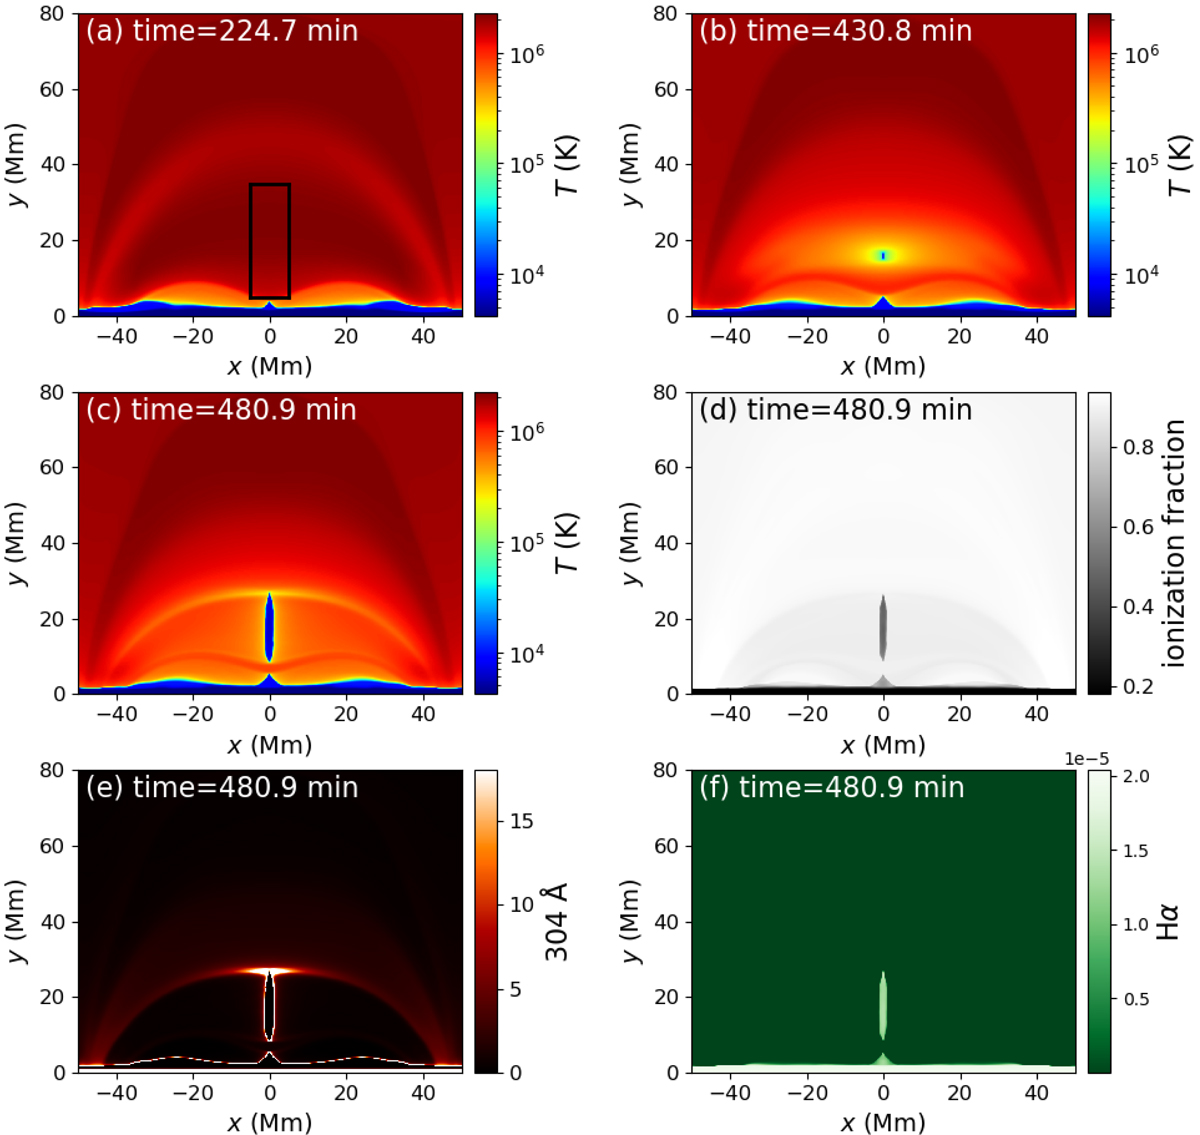
Fig. 2.
Download original image
Formation of the filament. (a)–(c) Temperature distributions during the formation of the filament at the times t = 224.7 min, t = 430.8 min and t = 480.9 min. An animation showing their evolution is available online. (d) Ionization fraction distribution at t = 480.9 min. (e) AIA 304 Å synthetic image at t = 480.9 min. (f) Approximate Hα synthetic image at t = 480.9 min. The units of the last two panels are arbitrary. See text for details.
Current usage metrics show cumulative count of Article Views (full-text article views including HTML views, PDF and ePub downloads, according to the available data) and Abstracts Views on Vision4Press platform.
Data correspond to usage on the plateform after 2015. The current usage metrics is available 48-96 hours after online publication and is updated daily on week days.
Initial download of the metrics may take a while.