Fig. 7.
Download original image
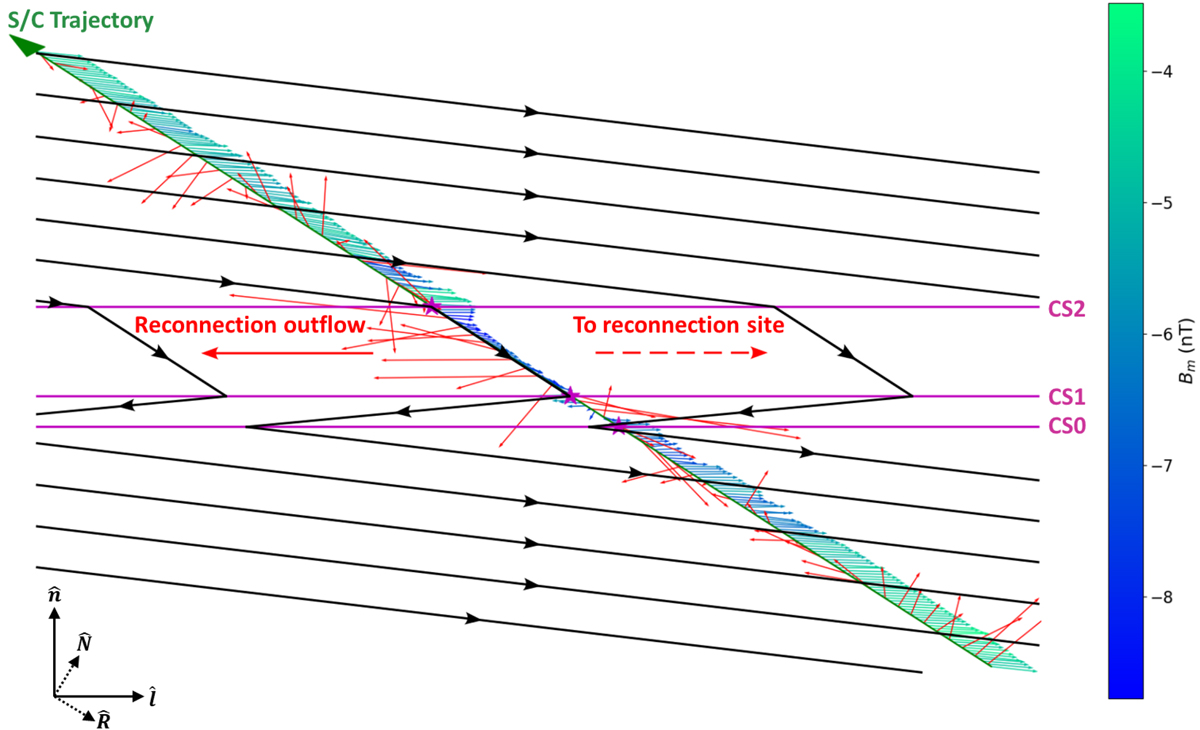
Feather plot of the B (blue/light green) and ![]() vectors measured in Event 1 in the ln-plane with the spacecraft trajectory marked by the dark green arrow. The Bm component of B is represented by the colour bar on the right. Overlaid on top is a possible interpretation of the magnetic field configuration of the switchback, shown here by the black arrows. The purple lines mark the assumed configuration of the current sheets CS0, CS1, and CS2. The purple stars show the locations where Solar Orbiter crosses the current sheets.
vectors measured in Event 1 in the ln-plane with the spacecraft trajectory marked by the dark green arrow. The Bm component of B is represented by the colour bar on the right. Overlaid on top is a possible interpretation of the magnetic field configuration of the switchback, shown here by the black arrows. The purple lines mark the assumed configuration of the current sheets CS0, CS1, and CS2. The purple stars show the locations where Solar Orbiter crosses the current sheets.
Current usage metrics show cumulative count of Article Views (full-text article views including HTML views, PDF and ePub downloads, according to the available data) and Abstracts Views on Vision4Press platform.
Data correspond to usage on the plateform after 2015. The current usage metrics is available 48-96 hours after online publication and is updated daily on week days.
Initial download of the metrics may take a while.