Fig. 2.
Download original image
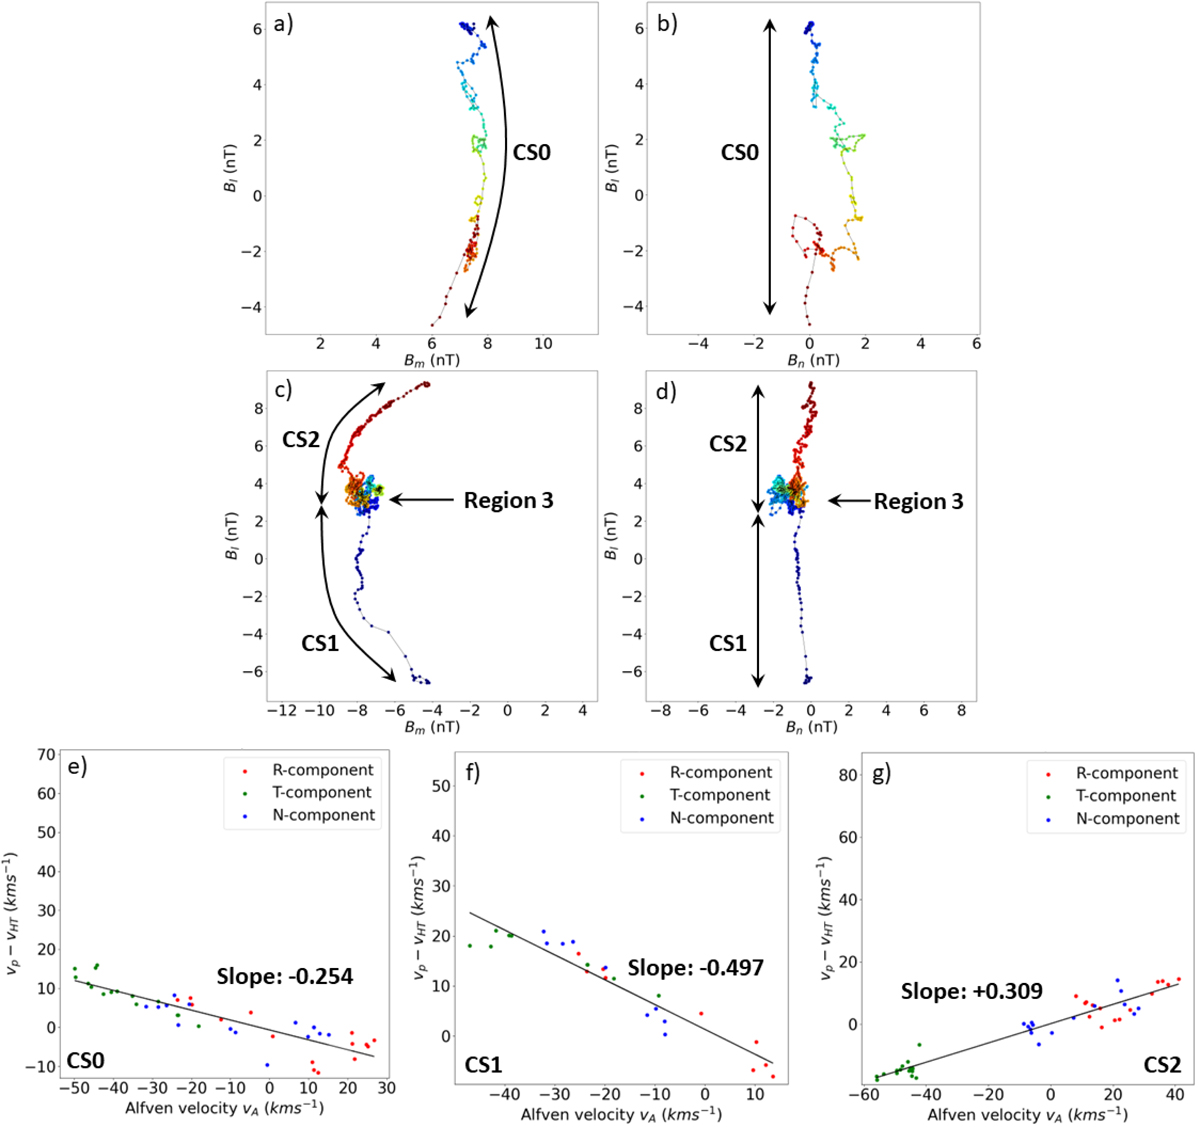
Magnetic hodographs and Walén plots for CS0 (07:45:50–07:46:20 UT), CS1 (07:46:35–07:46:43 UT), and CS2 (07:48:15–07:48:45 UT) in Event 1. Time progression in the hodographs is represented by the colour of the dots, with earlier times in blue and later times in red. The red, green, and blue dots in the Walén plots represent the R, T, and N-components of the Alfvén velocity vA and the HT frame bulk plasma velocity vp − vHT. a) lm-plane hodograph for CS0. b) ln-plane hodograph for CS0. c) lm-plane hodograph for CS1 and CS2. d) ln-plane hodograph for CS1 and CS2. e) Walén plot for CS0. f) Walén plot for CS1. g) Walén plot for CS2.
Current usage metrics show cumulative count of Article Views (full-text article views including HTML views, PDF and ePub downloads, according to the available data) and Abstracts Views on Vision4Press platform.
Data correspond to usage on the plateform after 2015. The current usage metrics is available 48-96 hours after online publication and is updated daily on week days.
Initial download of the metrics may take a while.