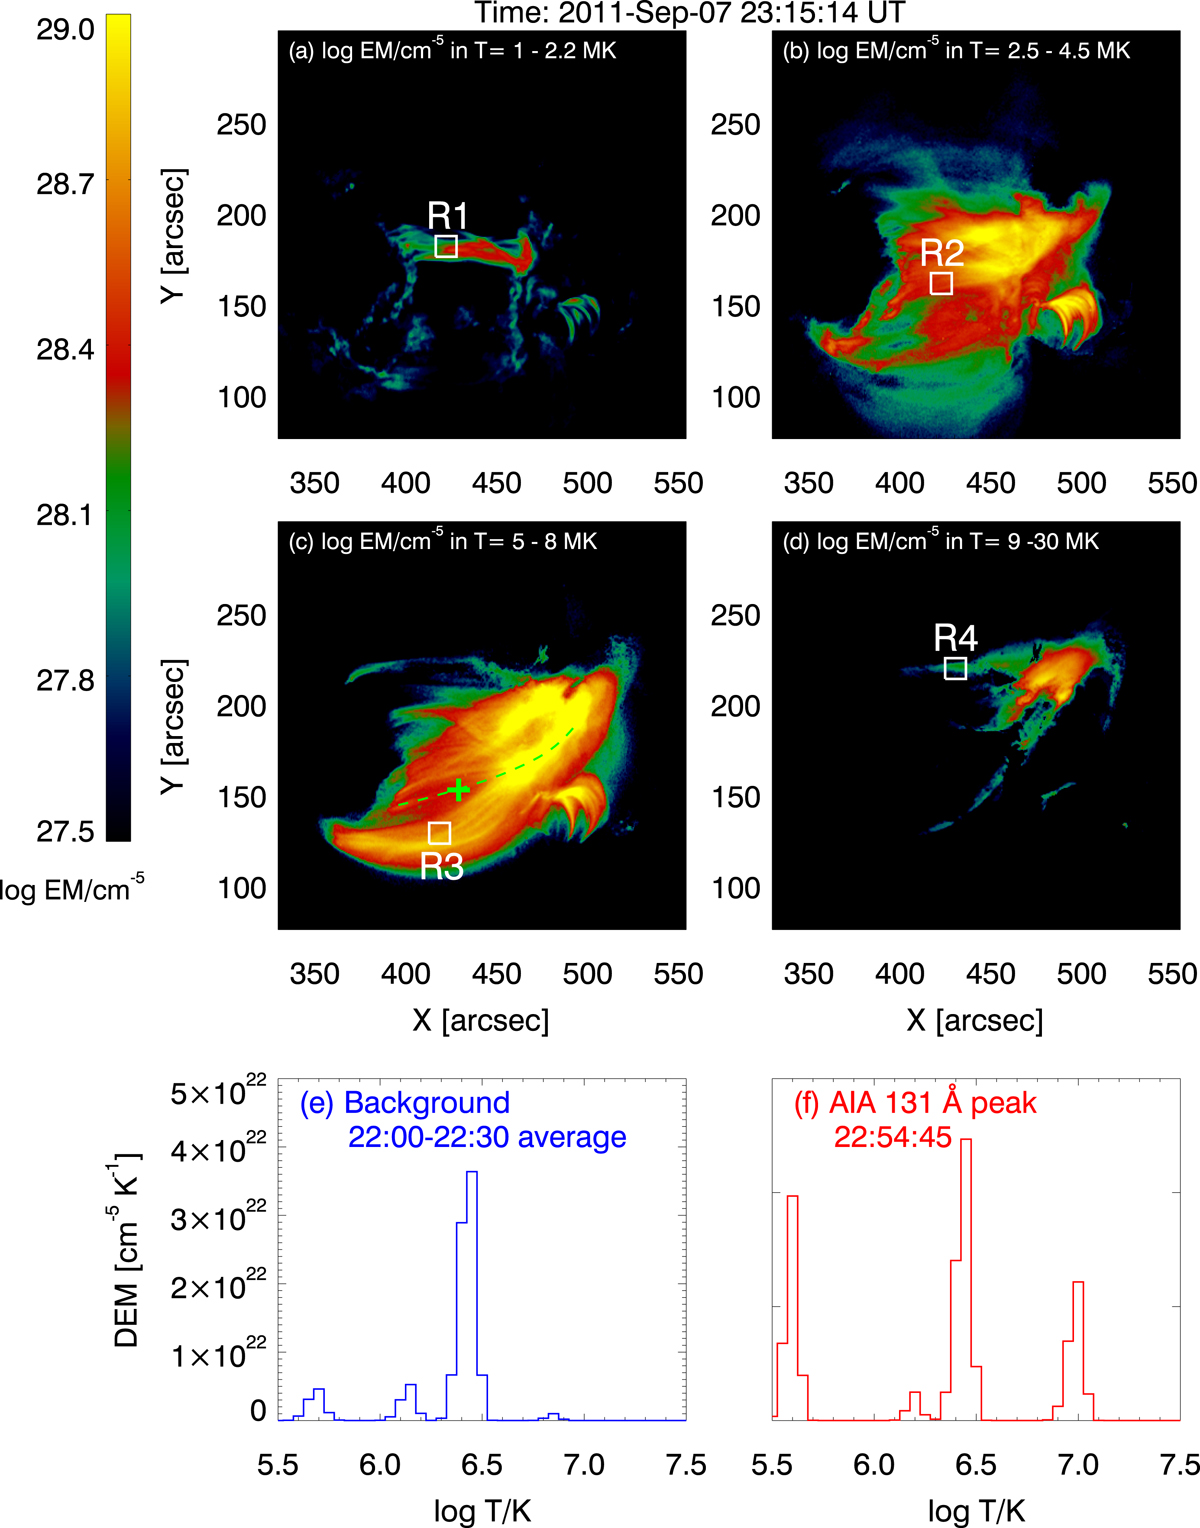
Fig. 9.
Download original image
Results of DEM inversion to the AR. Panels a–d display the EM maps of the AR at 23:15:14 UT within four different temperature bins. The small boxes (labeled R1–R4) are the same as in Fig. 8. Panels e and f plot the DEM distributions of a selected late-phase loop region (plus sign in the loop delineated by the dashed line) during the pre-event period and at the corresponding AIA 131 Å peak, respectively.
Current usage metrics show cumulative count of Article Views (full-text article views including HTML views, PDF and ePub downloads, according to the available data) and Abstracts Views on Vision4Press platform.
Data correspond to usage on the plateform after 2015. The current usage metrics is available 48-96 hours after online publication and is updated daily on week days.
Initial download of the metrics may take a while.