Fig. 5.
Download original image
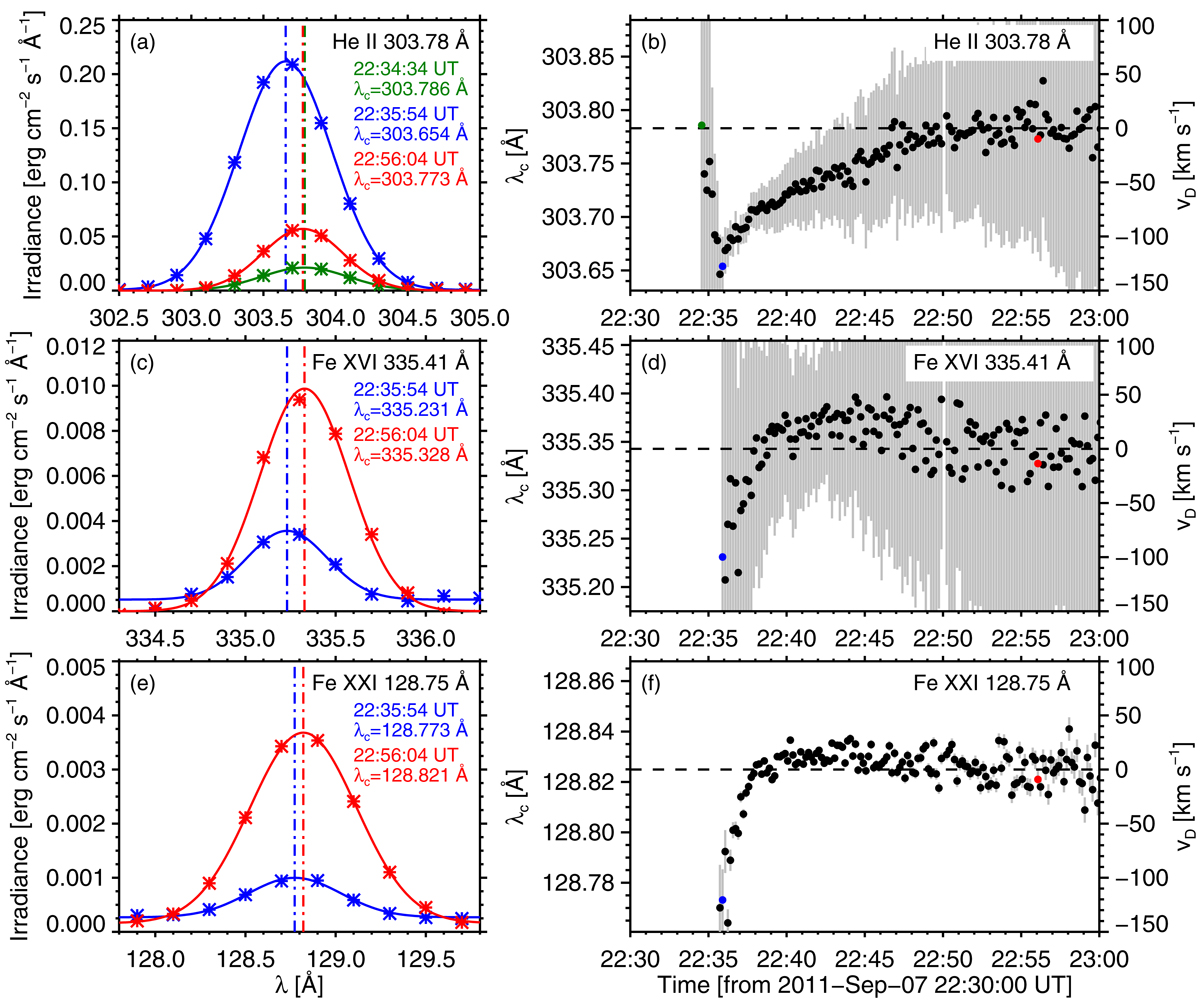
Results of the spectral fitting to EVE spectra and their temporal variations. Left: background-subtracted spectra of three EVE spectral lines (asterisks) observed at different stages of the flare (see legend for color-coding) as well as the results of a single-Gaussian fit (solid lines) to the observed spectra. The vertical dash-dotted lines denote the fitted line center. Right: temporal variations in the line center wavelength for the three EVE lines based on the Gaussian fit, with the fitting results plotted as filled circles and the corresponding fitting errors as gray error bars. In each panel the colored circles represent the same fitting results for the corresponding spectral line displayed in the left, and the horizontal dashed line indicates the rest wavelength of the line center, which is derived by averaging the fitting results over an interval of 22:50–23:00 UT when the main flare has turned to a gradual decay. With this reference wavelength, the variation in line center wavelength (scaled by the left axis) is further converted to an equivalent variation of Doppler velocity (scaled by the right axis).
Current usage metrics show cumulative count of Article Views (full-text article views including HTML views, PDF and ePub downloads, according to the available data) and Abstracts Views on Vision4Press platform.
Data correspond to usage on the plateform after 2015. The current usage metrics is available 48-96 hours after online publication and is updated daily on week days.
Initial download of the metrics may take a while.