Fig. 4.
Download original image
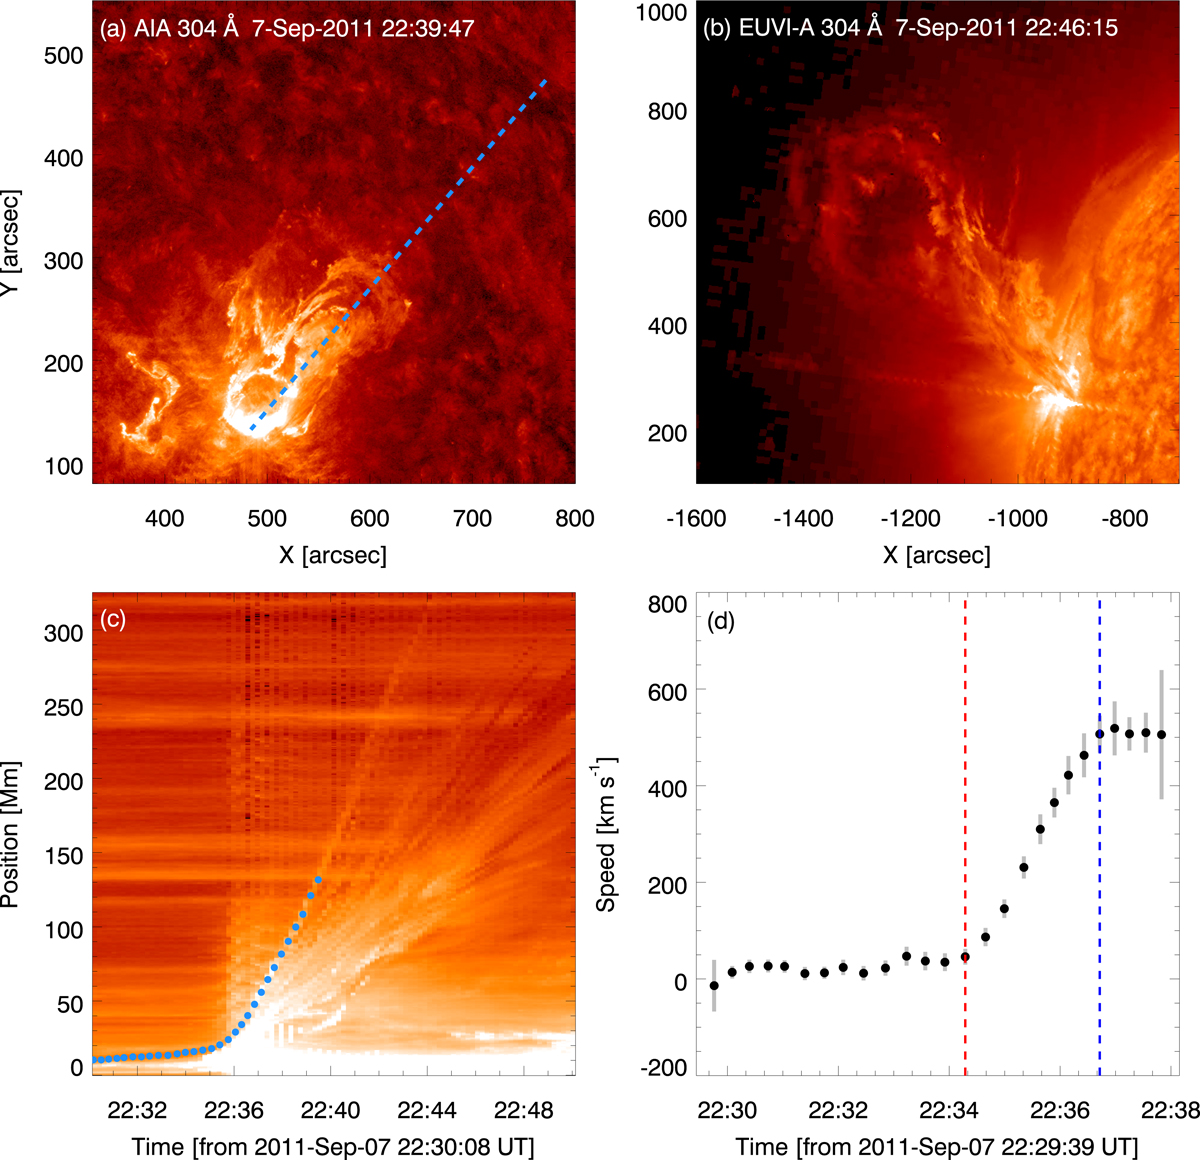
Eruption process of the flare-driving filament. Panels a and b demonstrate the snapshots of the filament eruption seen in SDO/AIA 304 Å and STEREO-A/EUVI 304 Å, respectively. Panel c shows the time-distance stack plot of the AIA 304 Å intensities along the slice drawn in panel a. Panel d displays the velocity evolution of the filament leading edge along the selected slice, which is traced by the filled circles plotted in panel c. The vertical dashed lines in panel d divide the eruption process into three stages.
Current usage metrics show cumulative count of Article Views (full-text article views including HTML views, PDF and ePub downloads, according to the available data) and Abstracts Views on Vision4Press platform.
Data correspond to usage on the plateform after 2015. The current usage metrics is available 48-96 hours after online publication and is updated daily on week days.
Initial download of the metrics may take a while.