Fig. 2.
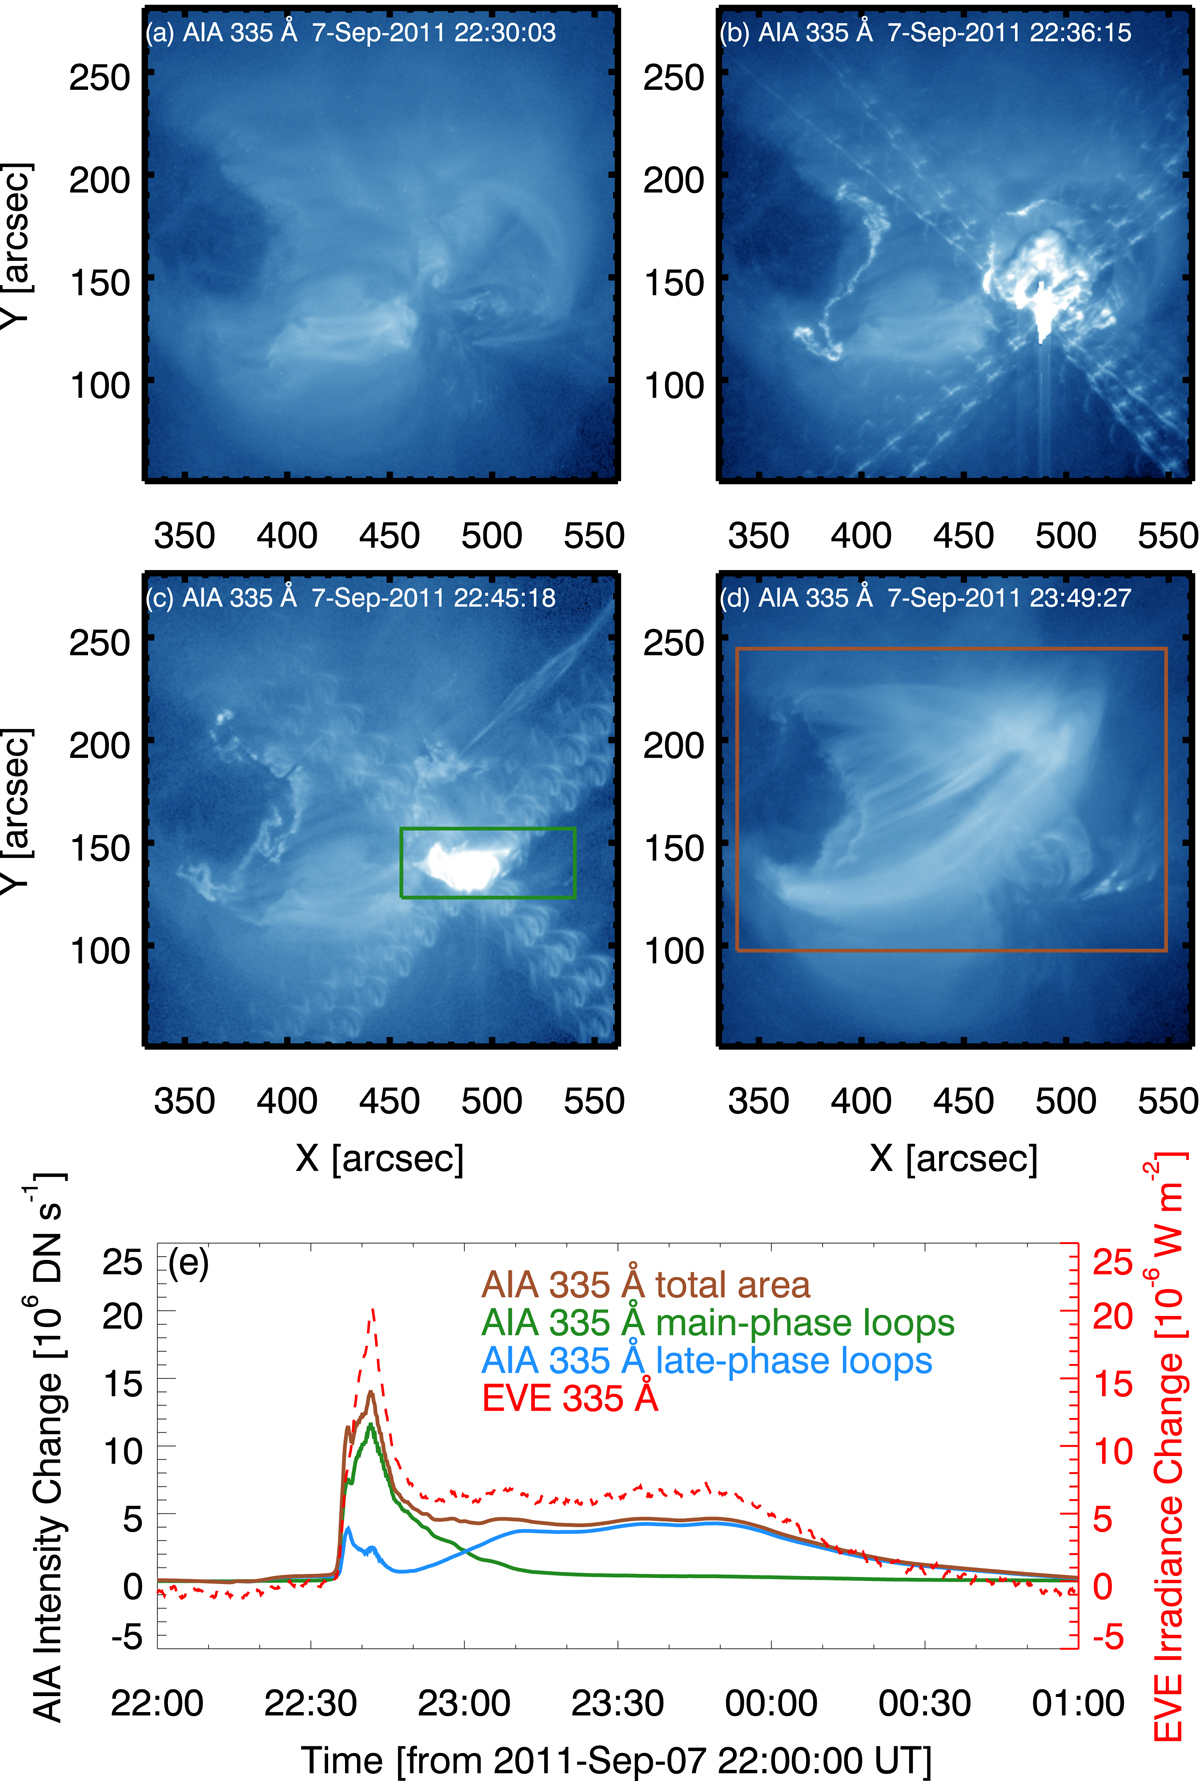
Download original image
Snapshots of flare evolution observed in the AIA 335 Å passband (a–d), and background-subtracted AIA 335 Å intensity profiles summed over specified regions (e). Shown are the whole flare-hosting AR (enclosed by the brown box in panel d), the main flare region (outlined by the green box in panel c), and the late-phase loop region (outside the main flare region, but within the AR). For comparison, the background-subtracted line irradiance in EVE 335 Å is also overplotted as the dashed line in panel e.
Current usage metrics show cumulative count of Article Views (full-text article views including HTML views, PDF and ePub downloads, according to the available data) and Abstracts Views on Vision4Press platform.
Data correspond to usage on the plateform after 2015. The current usage metrics is available 48-96 hours after online publication and is updated daily on week days.
Initial download of the metrics may take a while.