Fig. 1.
Download original image
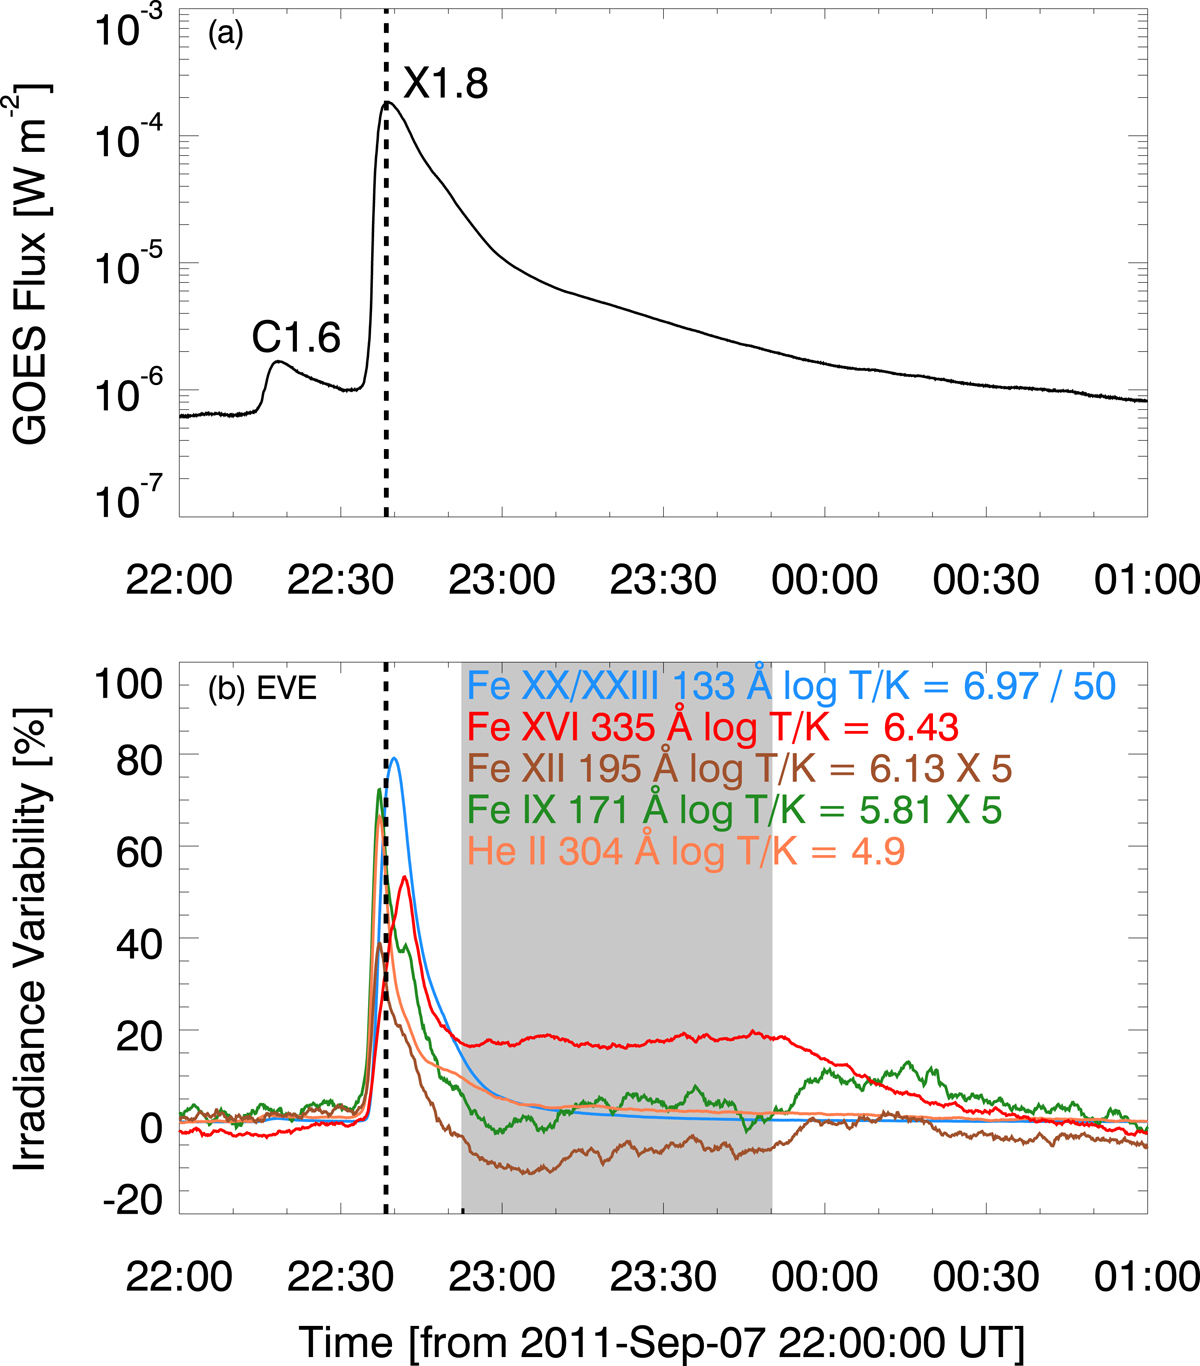
Time profiles of the GOES 1−8 Å flux (a) and irradiance variability in several EVE spectral lines (b) for the 2011 September 7 X1.8-class flare. The vertical dashed line denotes the peak time of the SXR flux, and the shaded region highlights the duration of the emission plateau seen in EVE 335 Å. When deriving the EVE irradiance variability, a background level is calculated by averaging the absolute irradiance over a quiescent period of 21:30−22:00 UT. In addition, a two-minute smoothing boxcar is applied to the EVE data points to enhance the signal-to-noise ratio.
Current usage metrics show cumulative count of Article Views (full-text article views including HTML views, PDF and ePub downloads, according to the available data) and Abstracts Views on Vision4Press platform.
Data correspond to usage on the plateform after 2015. The current usage metrics is available 48-96 hours after online publication and is updated daily on week days.
Initial download of the metrics may take a while.