Fig. 8.
Download original image
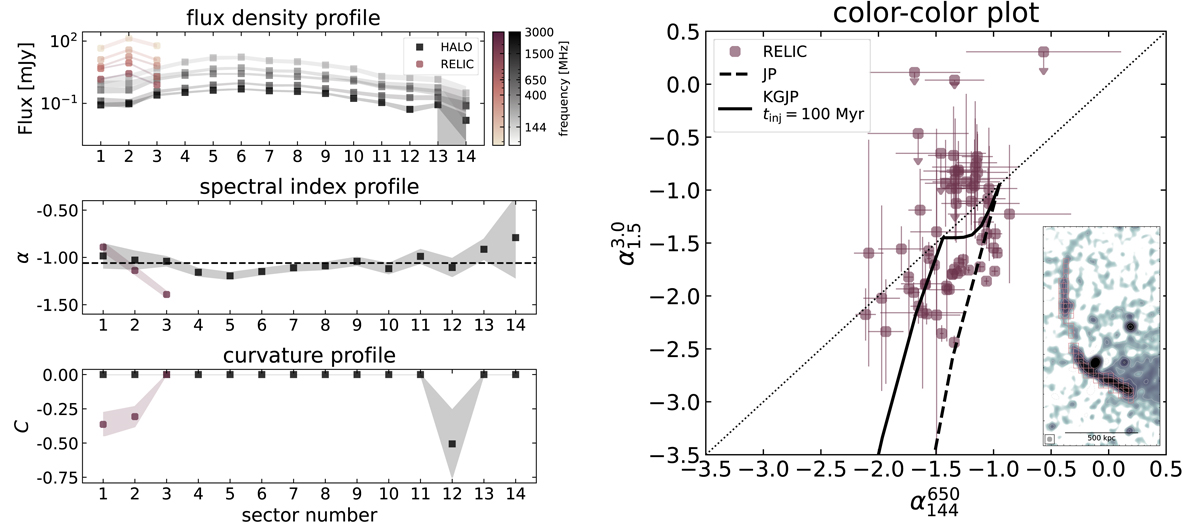
Spectral and curvature analysis of the relic in PSZ2G091. Left panel, from top to bottom: flux density, spectral index, curvature profiles across the relic and the halo at 12″ resolution. Purple circles refer to the relic and black squares to the halo. The box and sector numbers are shown in the right panel in Fig. 5; the black dashed line in the spectral index profile plot shows the integrated spectral index for the radio halo (i.e. ![]() ). Right panel: Radio colour-colour plot for the radio relic at 4.5″ resolution. (See inset for the location of the boxes.) Arrows refer to the upper limit in the spectral index; the dotted line shows the power-law case across the spectrum; and the solid and dashed lines display the KGJP (with a particle injection time tinj = 100 Myr) and JP ageing models.
). Right panel: Radio colour-colour plot for the radio relic at 4.5″ resolution. (See inset for the location of the boxes.) Arrows refer to the upper limit in the spectral index; the dotted line shows the power-law case across the spectrum; and the solid and dashed lines display the KGJP (with a particle injection time tinj = 100 Myr) and JP ageing models.
Current usage metrics show cumulative count of Article Views (full-text article views including HTML views, PDF and ePub downloads, according to the available data) and Abstracts Views on Vision4Press platform.
Data correspond to usage on the plateform after 2015. The current usage metrics is available 48-96 hours after online publication and is updated daily on week days.
Initial download of the metrics may take a while.