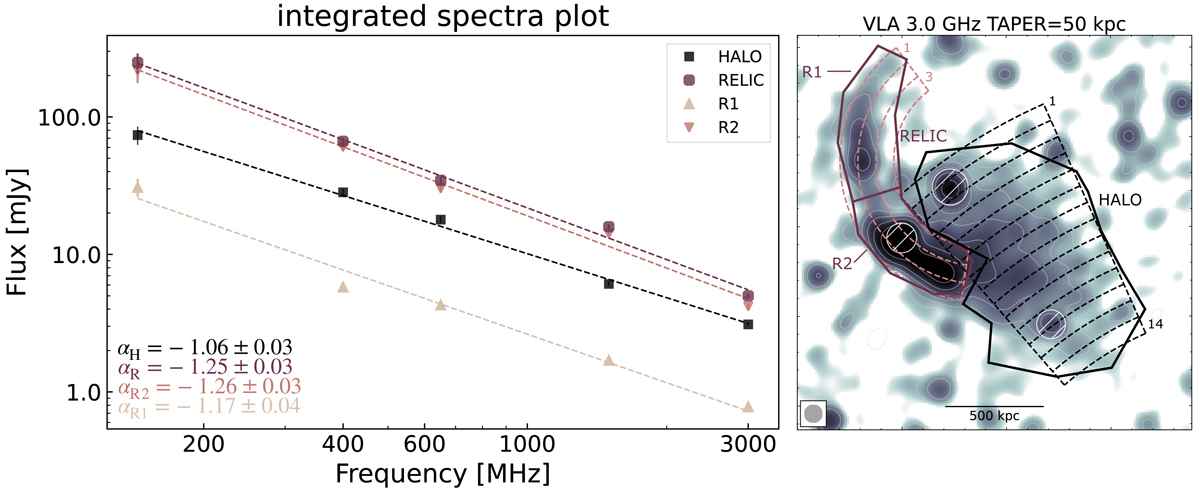
Fig. 5.
Download original image
Integrated spectra of the diffuse radio emission in PSZ2G091. Left: the flux densities were measured from the solid-line regions in the right panel, and the spectral indices are reported in the bottom-left corner in the panel (black for the halo and shades of purple for the relic). Right: Radio image and contours are from the 3.0 GHz VLA image at 12″ resolution. The separation of R1 and R2 is indicated by the purple solid line in the right panel. The dashed dashed-line sectors refer to the profiles displayed in Fig. 8. White circles mark the position of the compact sources that have been masked for the flux density, spectral and curvature profiles.
Current usage metrics show cumulative count of Article Views (full-text article views including HTML views, PDF and ePub downloads, according to the available data) and Abstracts Views on Vision4Press platform.
Data correspond to usage on the plateform after 2015. The current usage metrics is available 48-96 hours after online publication and is updated daily on week days.
Initial download of the metrics may take a while.