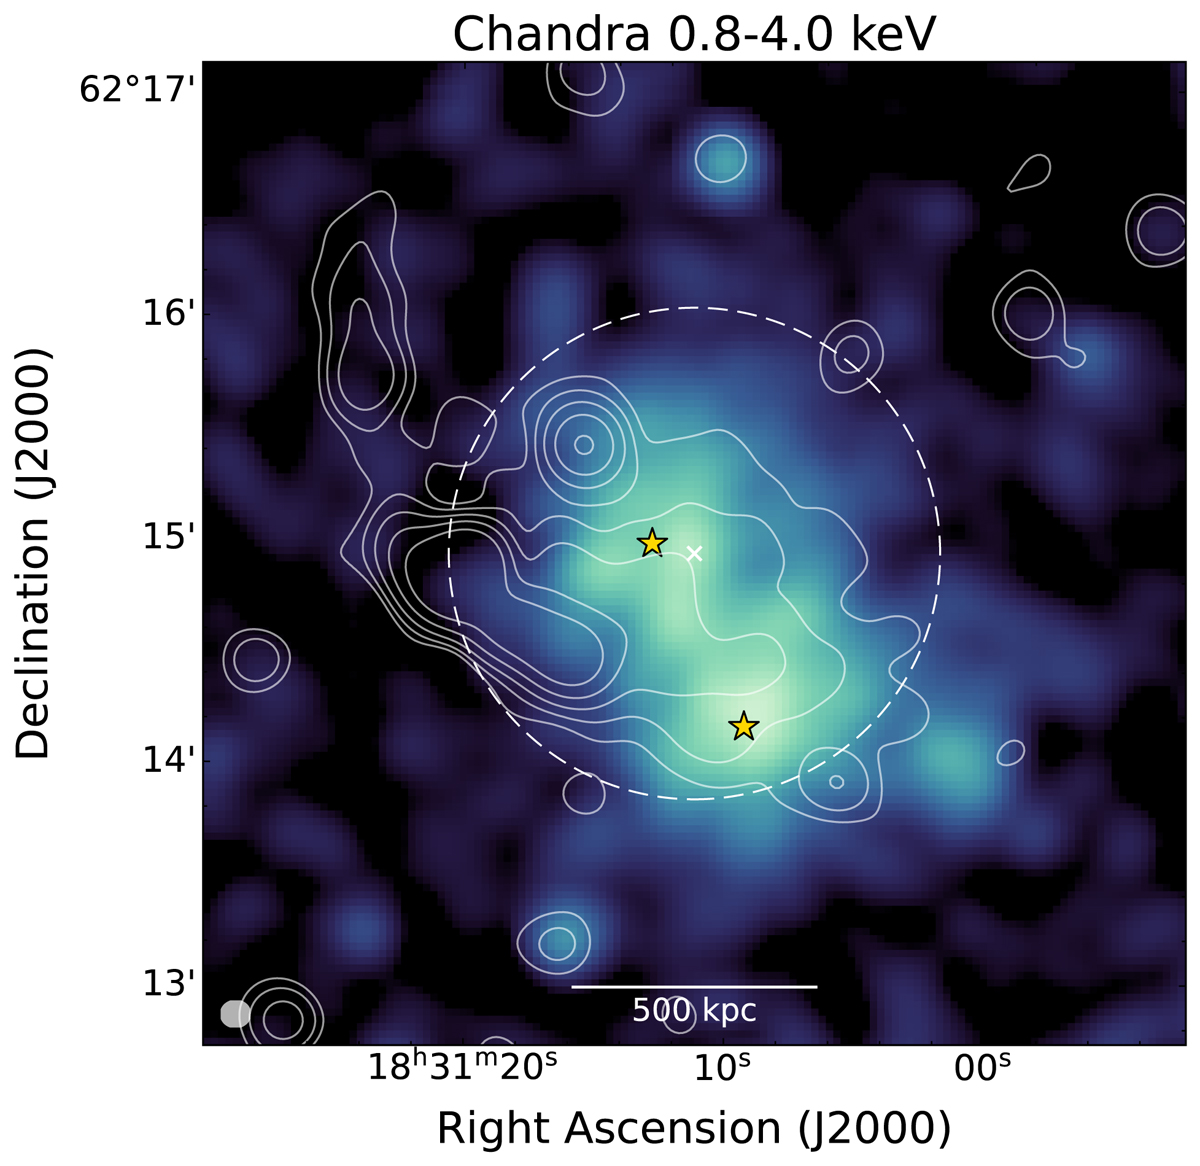
Fig. 4.
Download original image
Thermal and non-thermal comparison. X-ray 0.8–4.0 keV Chandra image with 3.0 GHz radio contours tapered at 50 kpc (contour levels are the same as for Fig. 2). The radio beam size is shown in the bottom-left corner. The white dashed circle shows the R = 0.5RSZ, 500 region, and the white cross denotes the cluster centre. The two yellow stars show the cluster X-ray peaks, which are associated with the two candidate sub-clusters (Artis et al. 2022).
Current usage metrics show cumulative count of Article Views (full-text article views including HTML views, PDF and ePub downloads, according to the available data) and Abstracts Views on Vision4Press platform.
Data correspond to usage on the plateform after 2015. The current usage metrics is available 48-96 hours after online publication and is updated daily on week days.
Initial download of the metrics may take a while.