Fig. 3.
Download original image
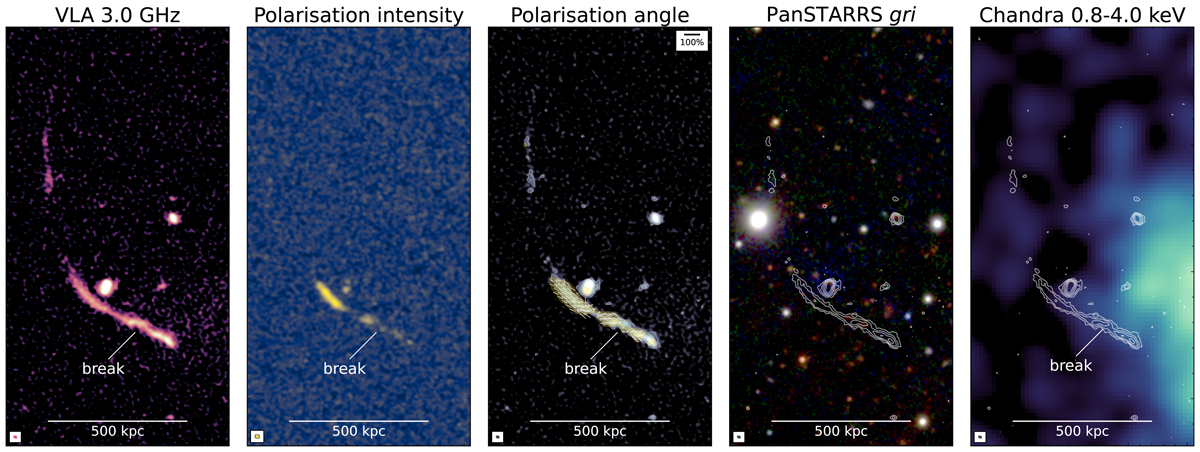
Zoom on the radio relic. From left to right: highest-resolution total intensity VLA image (i.e. 3.0 GHz at 1.8″ × 1.1″; see Table 3); total averaged polarisation intensity (without correction for Ricean bias, see Di Gennaro et al. 2021c) in the 2–4 GHz band (effective frequency 3.1 GHz) at 5″ resolution; high resolution-total intensity image at 3.0 GHz with the intrinsic polarisation magnetic field vectors at 5″ resolution, corrected for Faraday rotation; optical PanSTARRS gri image with radio contours from the leftmost panel starting from 2σrms; Chandra 0.8–4.0 keV image with radio contours from the leftmost panel starting from 2σrms.
Current usage metrics show cumulative count of Article Views (full-text article views including HTML views, PDF and ePub downloads, according to the available data) and Abstracts Views on Vision4Press platform.
Data correspond to usage on the plateform after 2015. The current usage metrics is available 48-96 hours after online publication and is updated daily on week days.
Initial download of the metrics may take a while.