Fig. 2.
Download original image
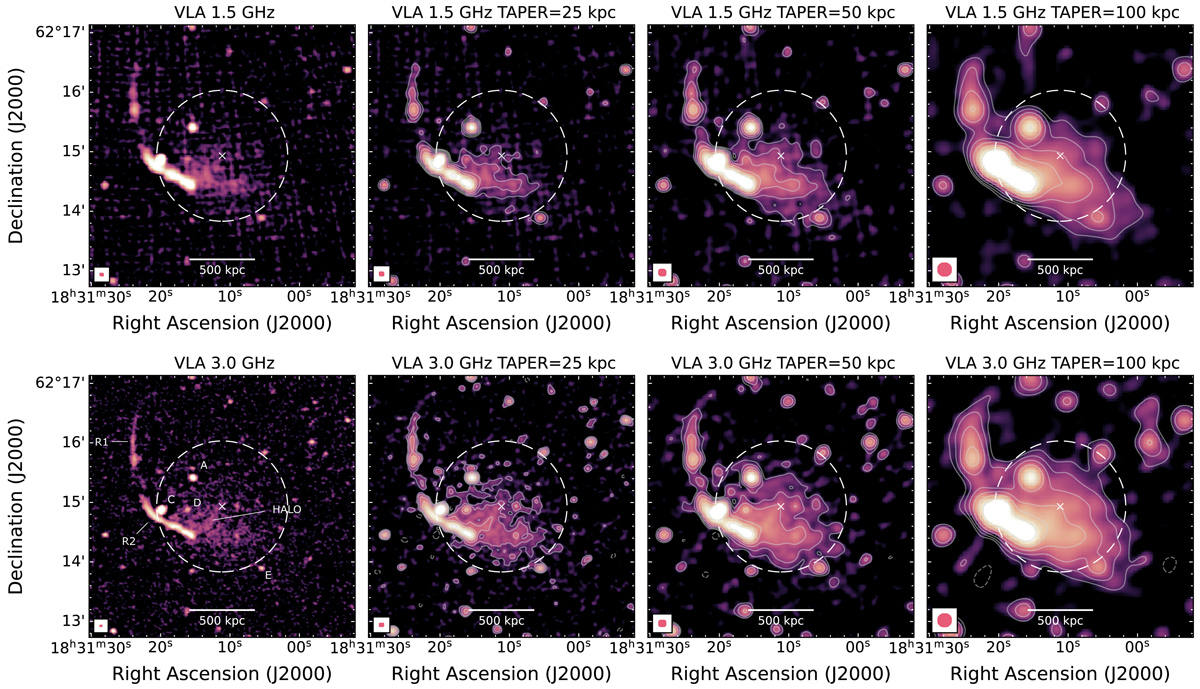
VLA images of PSZ2G091 at 1.5 GHz (top row) and 3.0 GHz (bottom row). From left to right: Full-resolution (i.e. no taper applied) taper of 25 kpc, 50 kpc, and 100 kpc (see Table 3 for the final resolutions and map noise). The beam size is shown in the bottom-left corner of each panel. Labels in the leftmost panel follow those shown in Di Gennaro et al. (2021b). The white dashed circle shows the R = 0.5RSZ, 500 region, and the cluster centre is marked with a white cross. Radio contours, when shown, are drawn with white solid lines at the 2.5σrms × [1, 2, 4, 8, 16, 32] levels; a −2.5σrms level is also drawn with a dashed line.
Current usage metrics show cumulative count of Article Views (full-text article views including HTML views, PDF and ePub downloads, according to the available data) and Abstracts Views on Vision4Press platform.
Data correspond to usage on the plateform after 2015. The current usage metrics is available 48-96 hours after online publication and is updated daily on week days.
Initial download of the metrics may take a while.