Fig. A.1.
Download original image
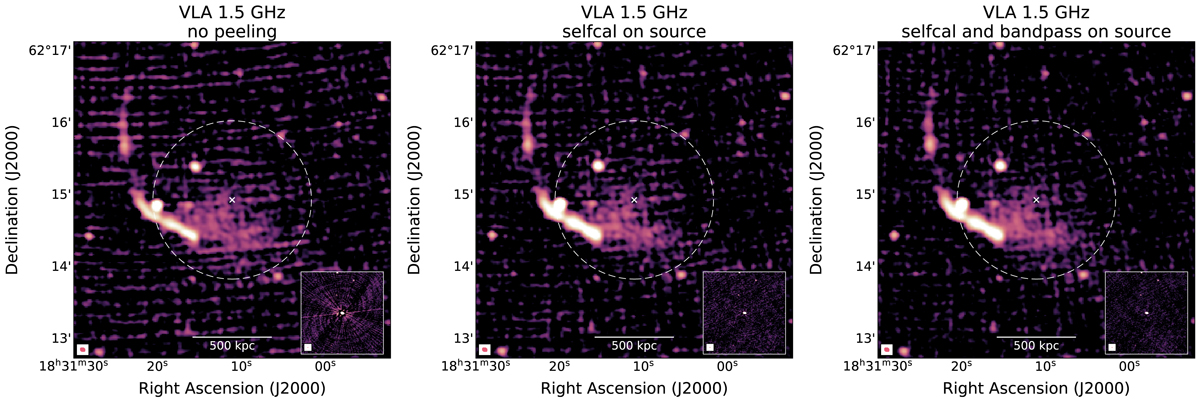
Peeling results on the 1–2 GHz observations of PSZ2G091. Left panel: Cluster image after standard selfcal. Middle panel: Cluster image after standard peeling. Right panel: Cluster image after additional rounds of bandpass calibration on the troubling source. In the inset of each panel, we show the improvement on the calibration of the troubling source, with the limits on the colourmap set to the last step.
Current usage metrics show cumulative count of Article Views (full-text article views including HTML views, PDF and ePub downloads, according to the available data) and Abstracts Views on Vision4Press platform.
Data correspond to usage on the plateform after 2015. The current usage metrics is available 48-96 hours after online publication and is updated daily on week days.
Initial download of the metrics may take a while.