Open Access
Fig. 9.
Download original image
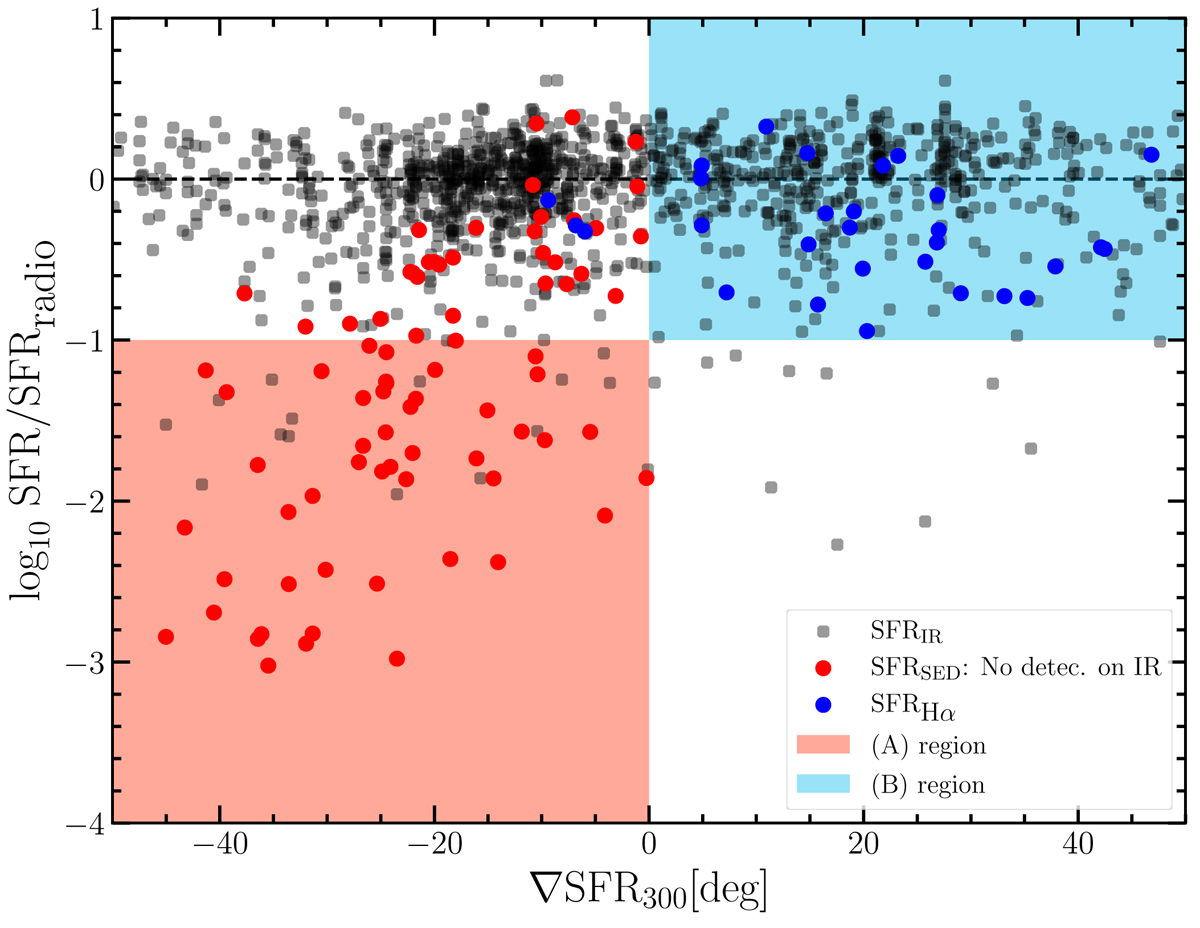
Ratio of the SFRradio and SFR from other tracers as a function of the SFR gradient over the last 300 Myr (∇SFR300). We use tree different SFR indicators: SFRIR, shown with black circles, SFRHα, shown with blue stars, and SFR![]() , shown with red circles. The galaxies marked with red circles are not detected in Herschel.
, shown with red circles. The galaxies marked with red circles are not detected in Herschel.
Current usage metrics show cumulative count of Article Views (full-text article views including HTML views, PDF and ePub downloads, according to the available data) and Abstracts Views on Vision4Press platform.
Data correspond to usage on the plateform after 2015. The current usage metrics is available 48-96 hours after online publication and is updated daily on week days.
Initial download of the metrics may take a while.