Open Access
Fig. 8.
Download original image
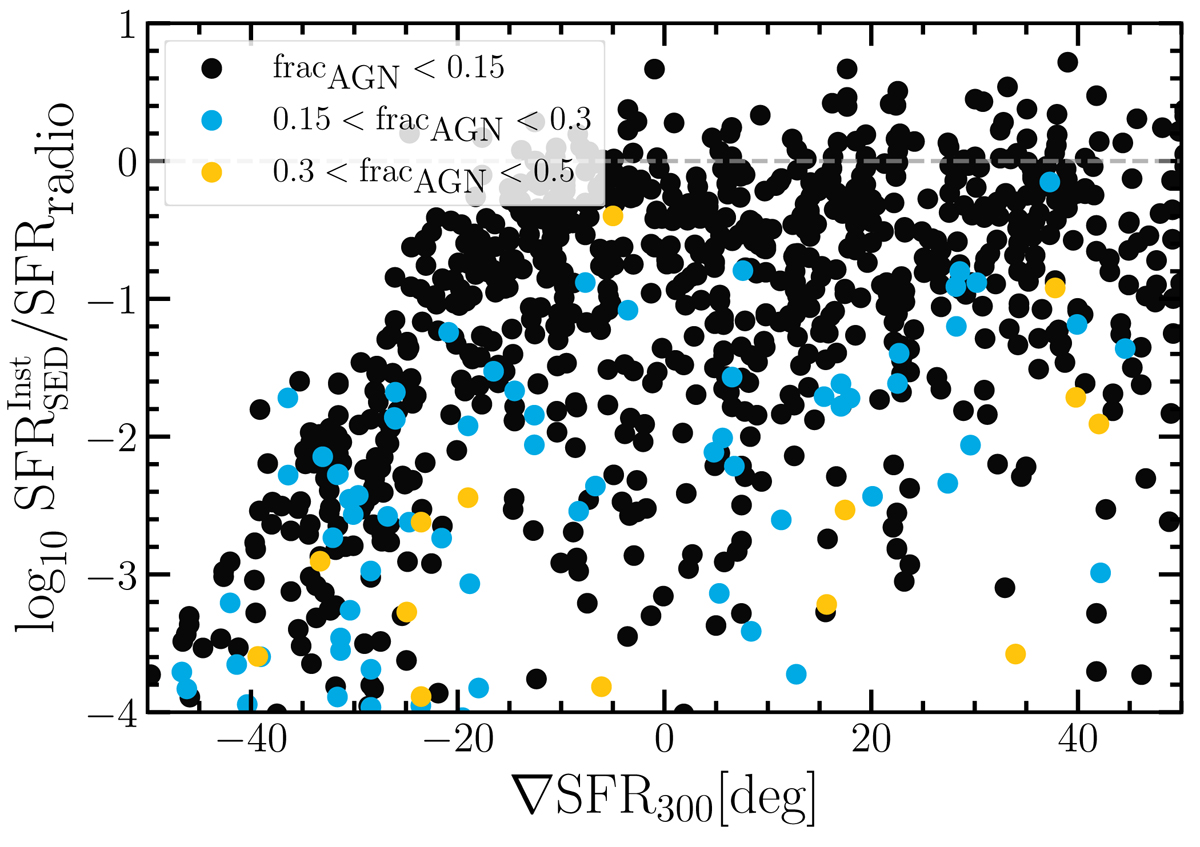
Ratio of the SFR![]() and the radio SFR as a function of the SFR gradient over the last 300 Myr, as in Fig. 3. The color-code represents the AGN fraction.
and the radio SFR as a function of the SFR gradient over the last 300 Myr, as in Fig. 3. The color-code represents the AGN fraction.
Current usage metrics show cumulative count of Article Views (full-text article views including HTML views, PDF and ePub downloads, according to the available data) and Abstracts Views on Vision4Press platform.
Data correspond to usage on the plateform after 2015. The current usage metrics is available 48-96 hours after online publication and is updated daily on week days.
Initial download of the metrics may take a while.