Fig. 6.
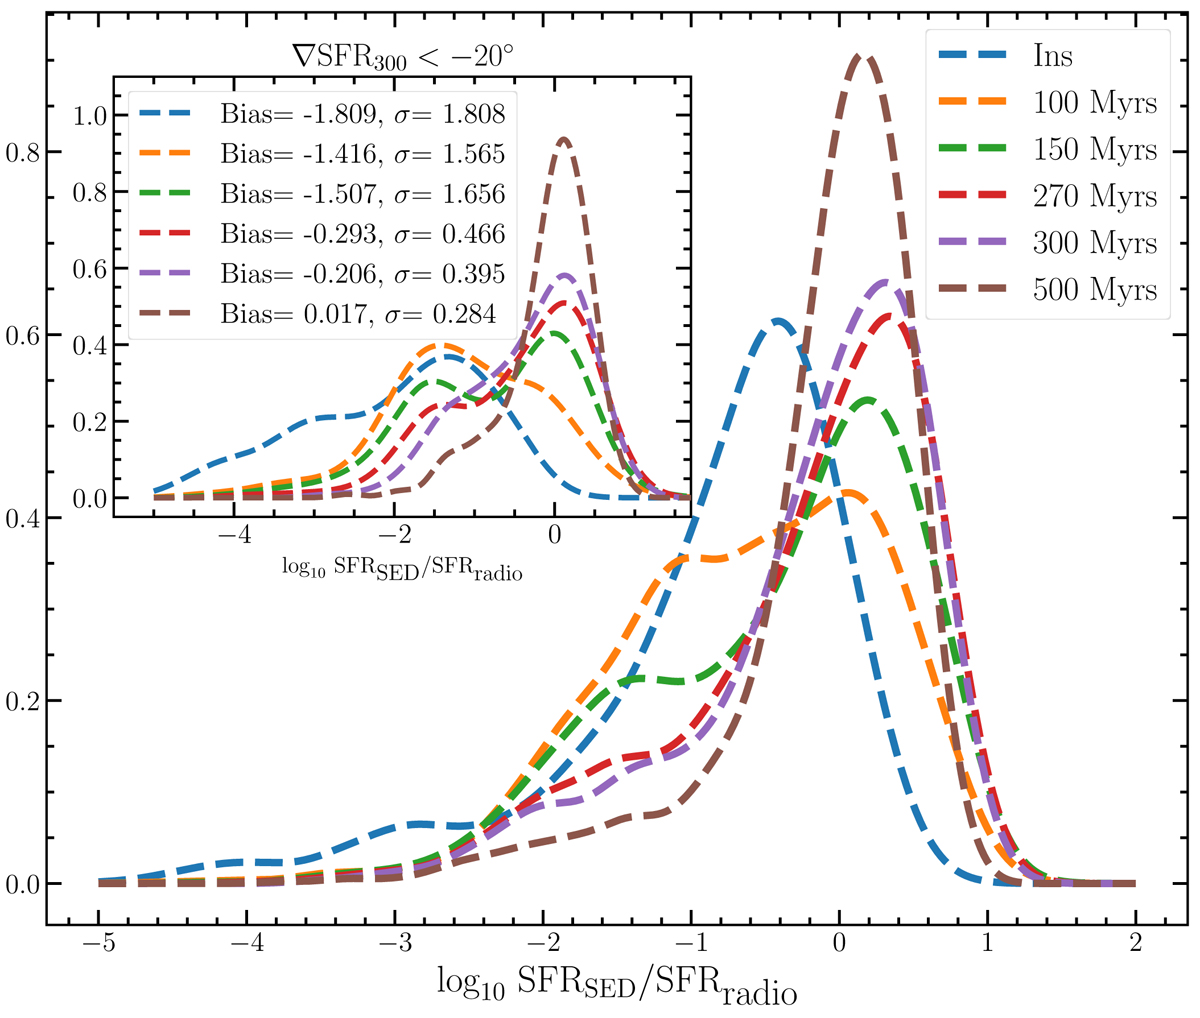
Download original image
Distribution (in logarithmic scale) of the ratio of the radio and SED SFRs. Each color corresponds to an SFRSED obtained by averaging the SFH over different timescales from 100 Myr up to 500 Myr. The inset presents the same statistics, but selects only galaxies with a declining SFH (∇SFR300 ≤ −20). The bias and the dispersion are indicated for each timescale.
Current usage metrics show cumulative count of Article Views (full-text article views including HTML views, PDF and ePub downloads, according to the available data) and Abstracts Views on Vision4Press platform.
Data correspond to usage on the plateform after 2015. The current usage metrics is available 48-96 hours after online publication and is updated daily on week days.
Initial download of the metrics may take a while.