Fig. 4.
Download original image
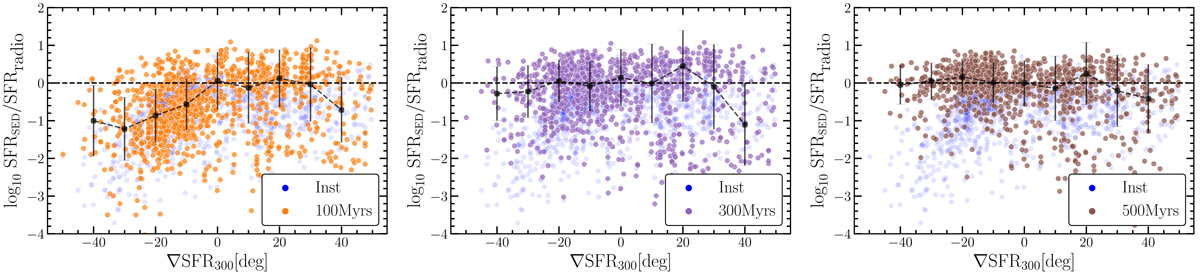
Ratios of the SFRSED and the SFRradio as a function of the SFR gradient over the last 300 Myr (∇SFR300). Galaxies with ∇SFR300 < 0 present a recent quenching, and galaxies with ∇SFR300 > 0 present a recent starburst. Blue dots show instantaneous values of the SFR![]() , and the orange, purple, and brown circles show an SFRSED that was averaged for the last 100, 300, and 500 Myr, respectively. Black dots shows the mean trend and the dispersion of SFR ratio along the ∇SFR300 inside a fixed bin size of 10°. The color-codes are the same as in Fig. 6.
, and the orange, purple, and brown circles show an SFRSED that was averaged for the last 100, 300, and 500 Myr, respectively. Black dots shows the mean trend and the dispersion of SFR ratio along the ∇SFR300 inside a fixed bin size of 10°. The color-codes are the same as in Fig. 6.
Current usage metrics show cumulative count of Article Views (full-text article views including HTML views, PDF and ePub downloads, according to the available data) and Abstracts Views on Vision4Press platform.
Data correspond to usage on the plateform after 2015. The current usage metrics is available 48-96 hours after online publication and is updated daily on week days.
Initial download of the metrics may take a while.