Fig. 3.
Download original image
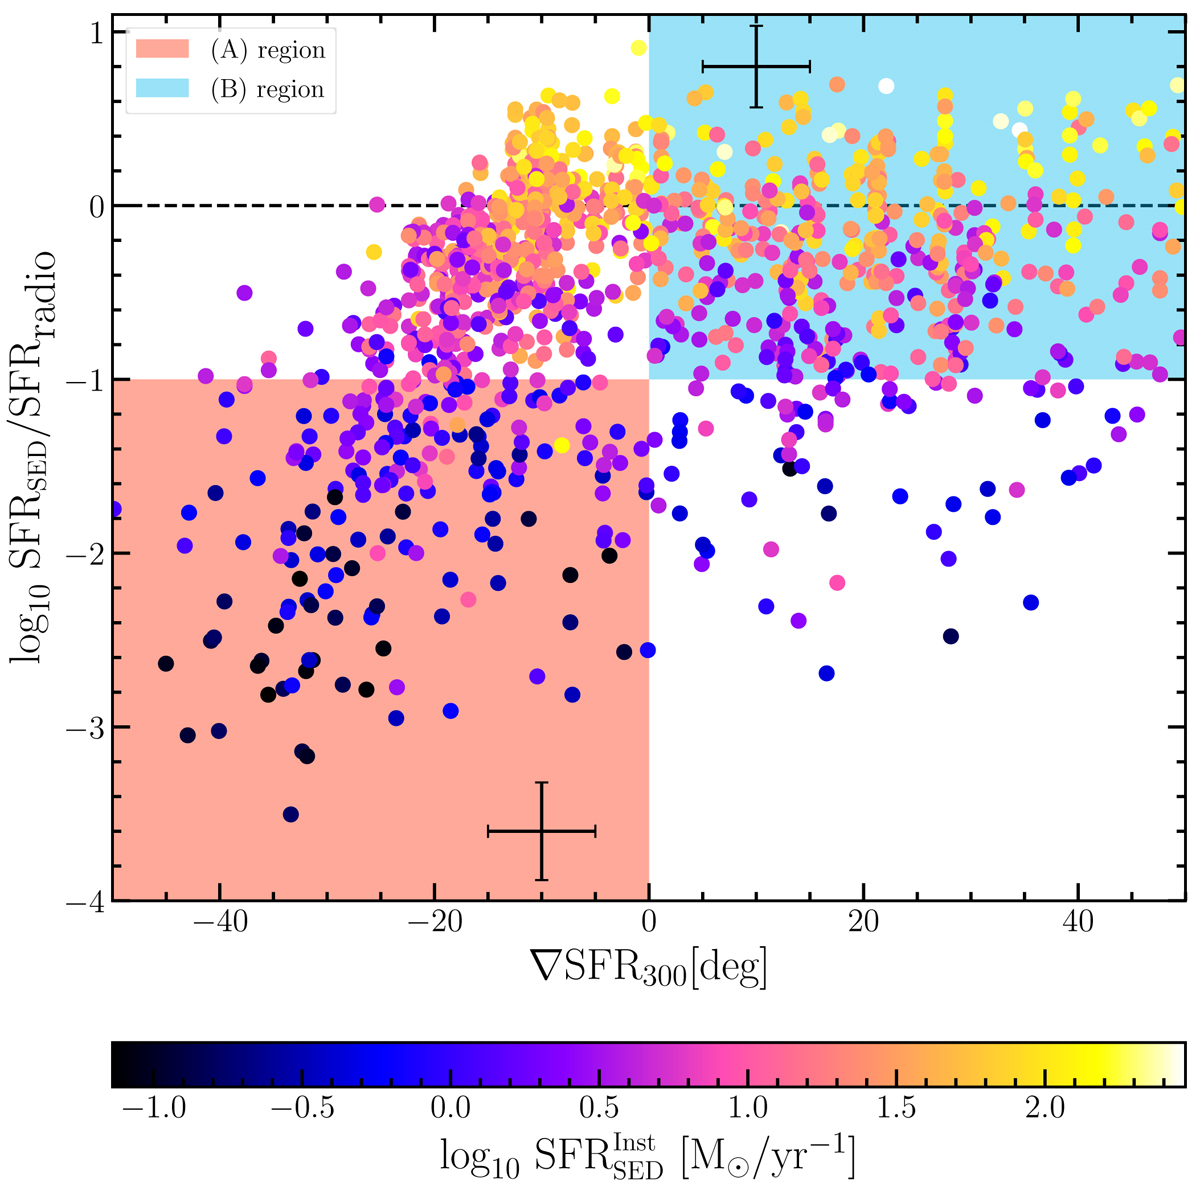
Ratio of the SFR![]() and SFRradio as a function of the SFR gradient over the last 300 Myr (∇SFR300). In perfect scenarios in which the two indicators give the same value, we expect a uniform distribution centered at 1 (but 0 in log) over the SFRs ratios along the ∇SFR300. The shaded red region shows galaxies with negative values of the ∇SFR300 (i.e., quenched) and an SFR ratio lower than 0.1, and the shaded region shows galaxies with positive values of the ∇SFR300 (i.e., starbursting) and an SFR ratio higher than 0.1. The dots are color-coded according to the instantaneous SFR derived from the SED fitting procedure. The mean error bars are shown as black crosses for galaxies inside regions (A) and (B).
and SFRradio as a function of the SFR gradient over the last 300 Myr (∇SFR300). In perfect scenarios in which the two indicators give the same value, we expect a uniform distribution centered at 1 (but 0 in log) over the SFRs ratios along the ∇SFR300. The shaded red region shows galaxies with negative values of the ∇SFR300 (i.e., quenched) and an SFR ratio lower than 0.1, and the shaded region shows galaxies with positive values of the ∇SFR300 (i.e., starbursting) and an SFR ratio higher than 0.1. The dots are color-coded according to the instantaneous SFR derived from the SED fitting procedure. The mean error bars are shown as black crosses for galaxies inside regions (A) and (B).
Current usage metrics show cumulative count of Article Views (full-text article views including HTML views, PDF and ePub downloads, according to the available data) and Abstracts Views on Vision4Press platform.
Data correspond to usage on the plateform after 2015. The current usage metrics is available 48-96 hours after online publication and is updated daily on week days.
Initial download of the metrics may take a while.