Fig. 2.
Download original image
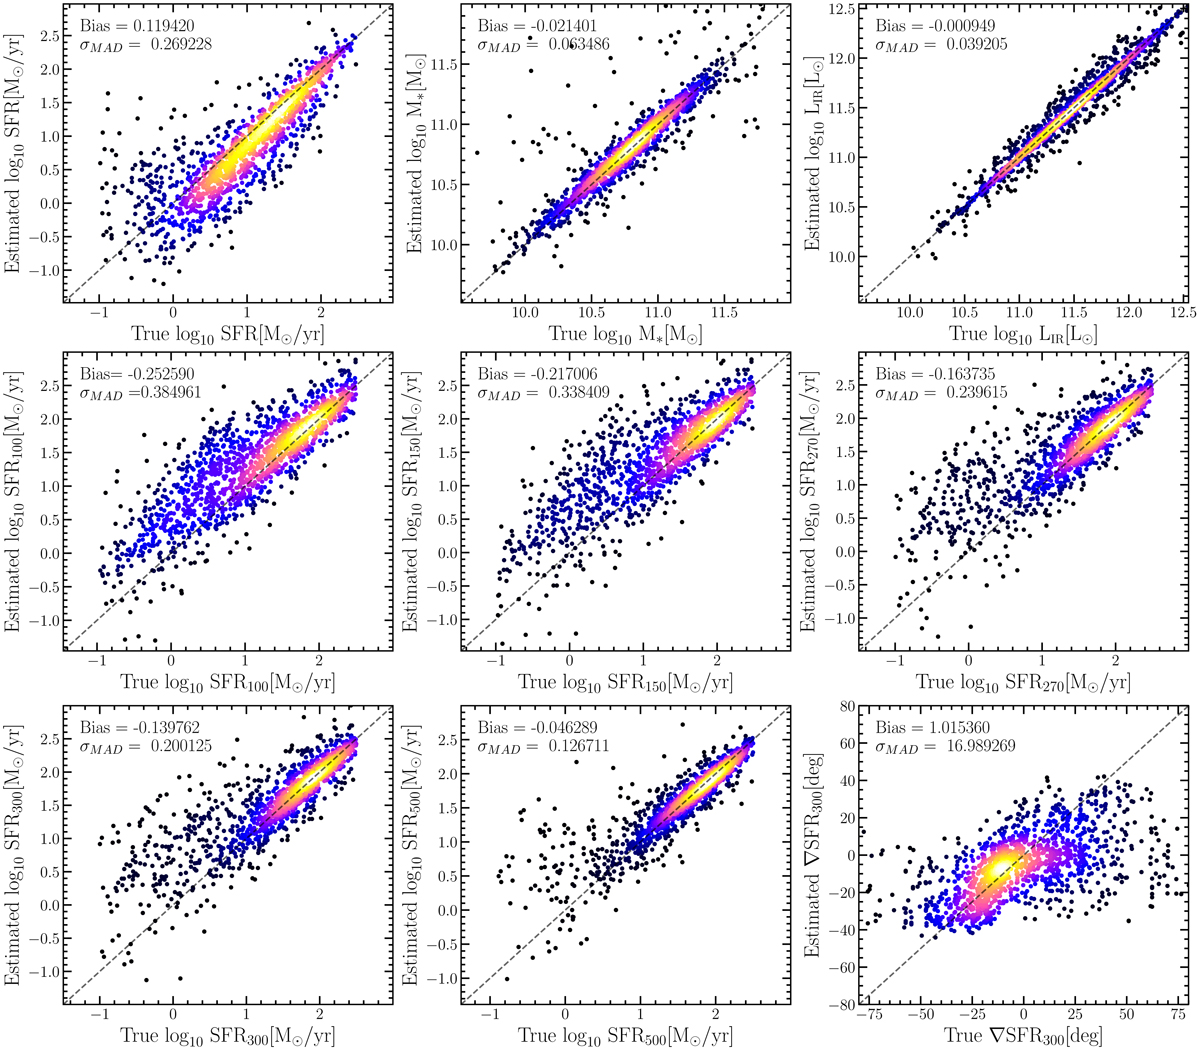
Results of the mock analysis for the SED modeling using the nonparametric SFH model. The input parameters we used to build the mock catalog are shown on the x-axis, and the results from fitting the mock catalogs are shown on the y-axis. From left to right, the upper panels present the instantaneous SFR, the stellar mass M*, and the IR luminosity LIR. The middle panels present the time-averaged SFRs for the last 100, 150, and 270 Myr over the SFH, and the bottom panels present the time-averaged SFRs for the last 270 and 500 Myr over the SFH as well as the SFR gradient computed over the last 300 Myr. The one-to-one relation is indicated by the solid black lines. The bias and precision estimated for the parameters are indicated in each panel.
Current usage metrics show cumulative count of Article Views (full-text article views including HTML views, PDF and ePub downloads, according to the available data) and Abstracts Views on Vision4Press platform.
Data correspond to usage on the plateform after 2015. The current usage metrics is available 48-96 hours after online publication and is updated daily on week days.
Initial download of the metrics may take a while.