Open Access
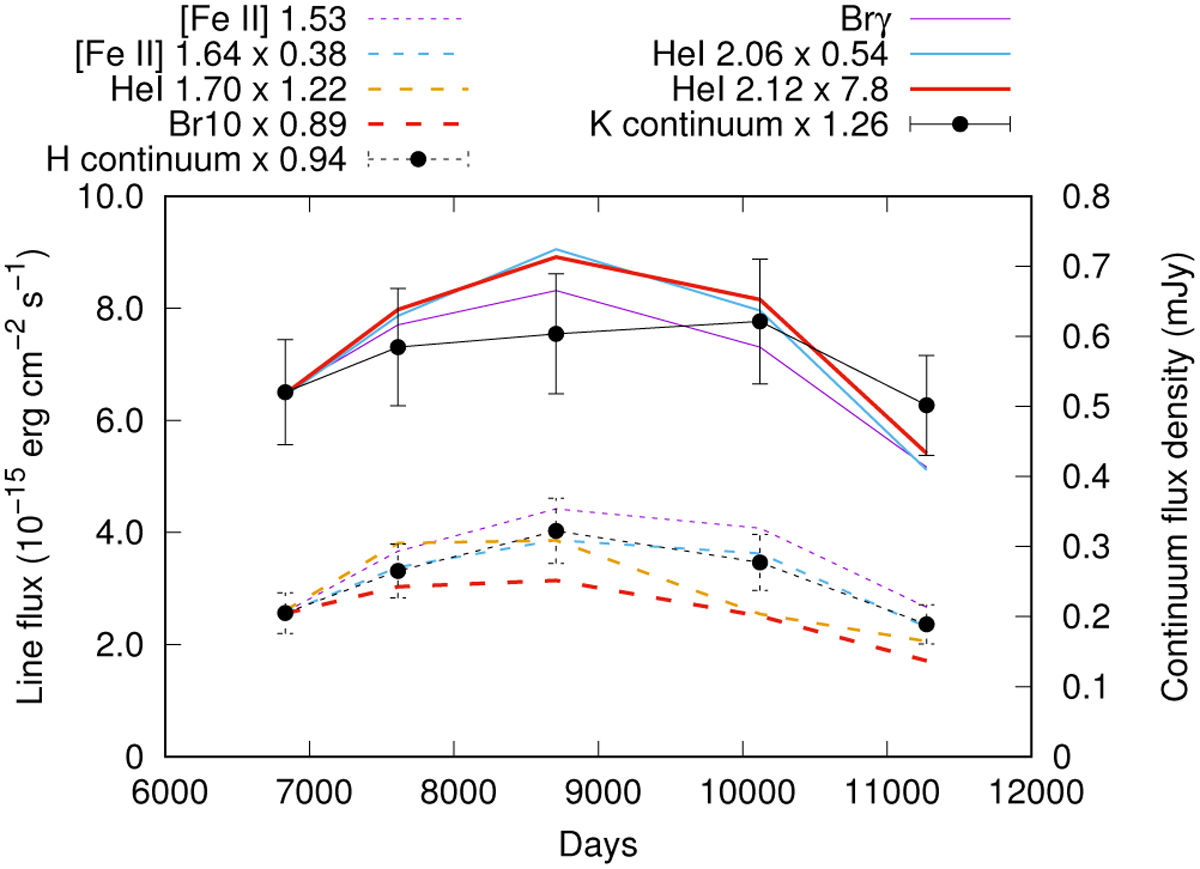
Fig. 9
Download original image
Emission line flux evolution over time, compared to the continuum flux density in the H and K bands as measured from the SINFONI spectra. All fluxes are scaled to match in the first SINFONI spectrum.
Current usage metrics show cumulative count of Article Views (full-text article views including HTML views, PDF and ePub downloads, according to the available data) and Abstracts Views on Vision4Press platform.
Data correspond to usage on the plateform after 2015. The current usage metrics is available 48-96 hours after online publication and is updated daily on week days.
Initial download of the metrics may take a while.