Open Access
Fig. 5
Download original image
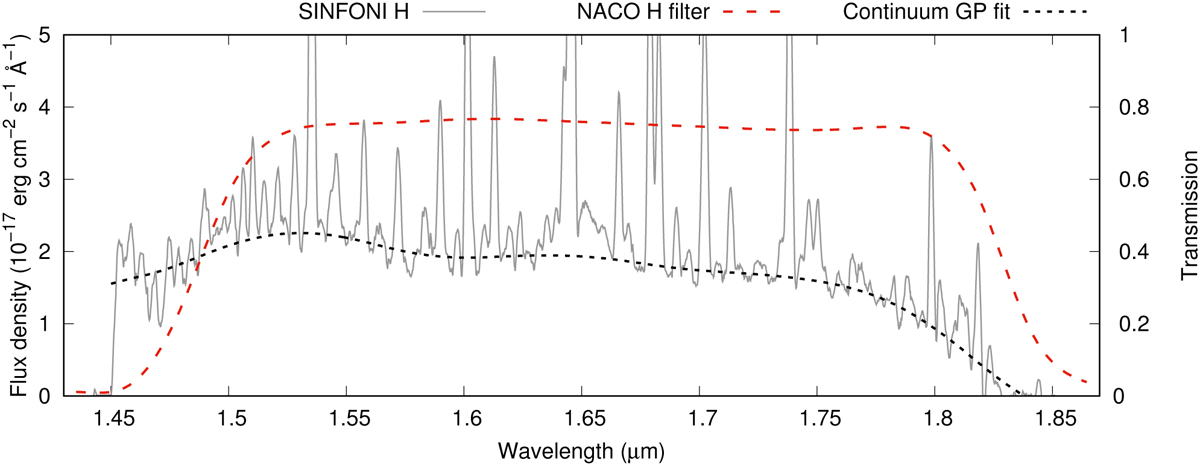
Example of a SINFONI H-band spectrum from 2017 before (solid gray line) and after line removal and GP fitting (dotted black line). The extent of the NACO H-band filter is overplotted (dashed red line). Savitzky-Golay smoothing has been applied to the original spectrum.
Current usage metrics show cumulative count of Article Views (full-text article views including HTML views, PDF and ePub downloads, according to the available data) and Abstracts Views on Vision4Press platform.
Data correspond to usage on the plateform after 2015. The current usage metrics is available 48-96 hours after online publication and is updated daily on week days.
Initial download of the metrics may take a while.