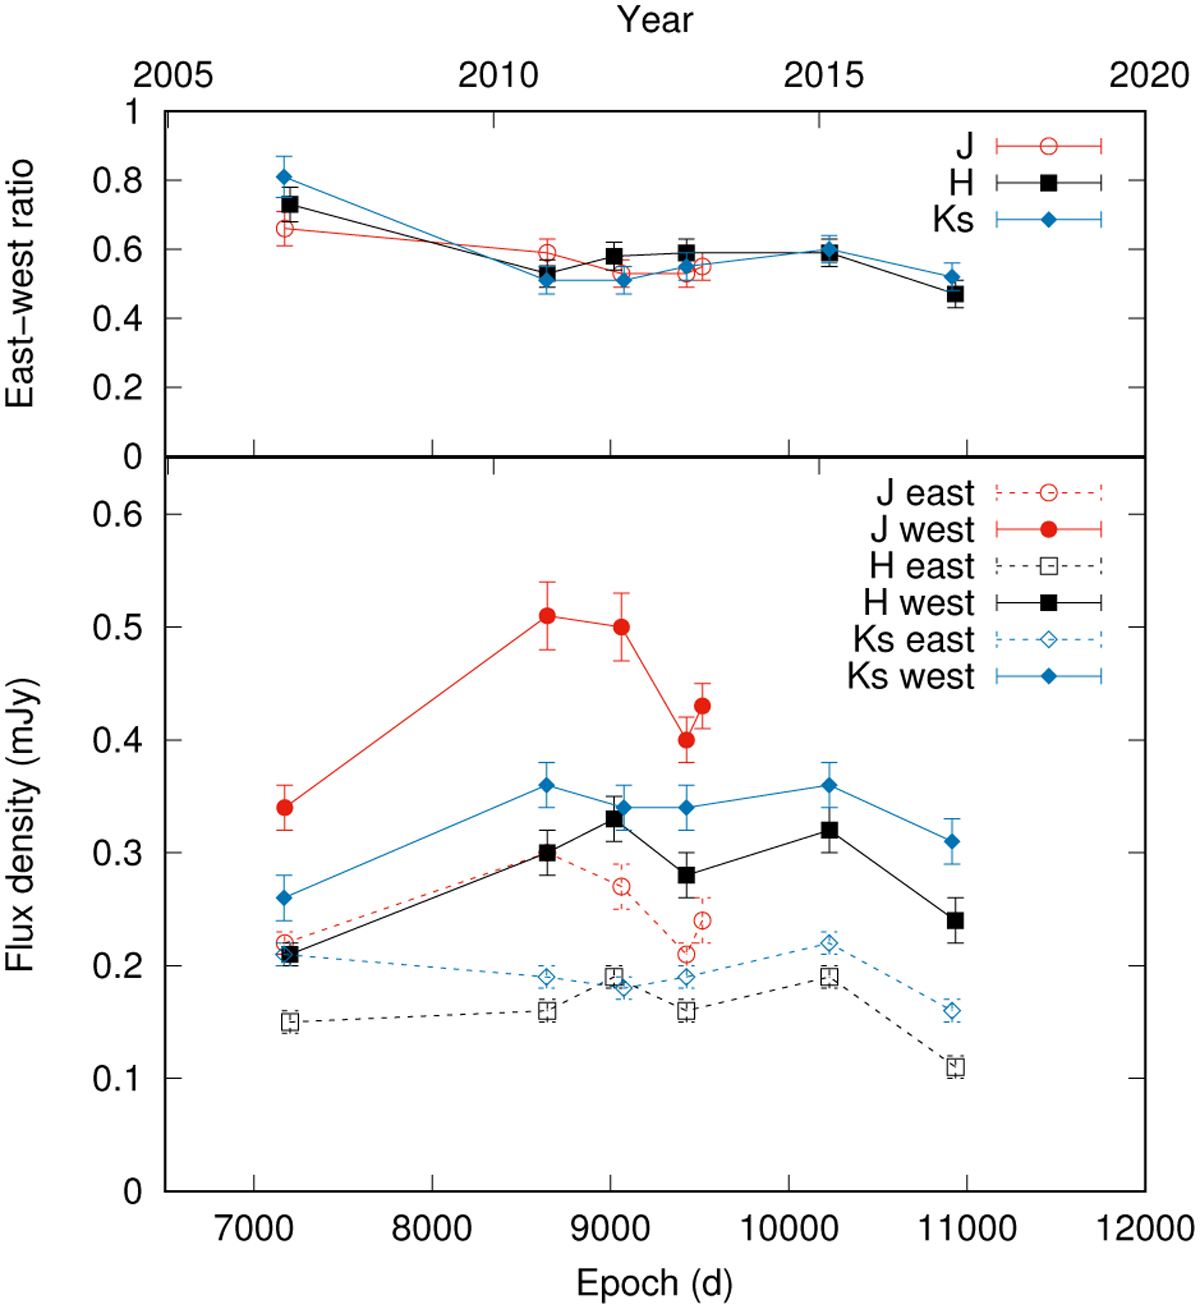
Fig. 16
Download original image
Comparison between the east and west halves of the ER. Top: evolution of the east-west flux density ratio over time in each band. The clearest change occurs between 2006 and 2010. Bottom: light curves of the east (open symbols and dashed lines) and west (solid symbols and lines) halves. The strongest difference in evolution again occurs between 2006 and 2010, and mainly in the west. Afterward, the evolution is similar in both halves.
Current usage metrics show cumulative count of Article Views (full-text article views including HTML views, PDF and ePub downloads, according to the available data) and Abstracts Views on Vision4Press platform.
Data correspond to usage on the plateform after 2015. The current usage metrics is available 48-96 hours after online publication and is updated daily on week days.
Initial download of the metrics may take a while.