Fig. 14
Download original image
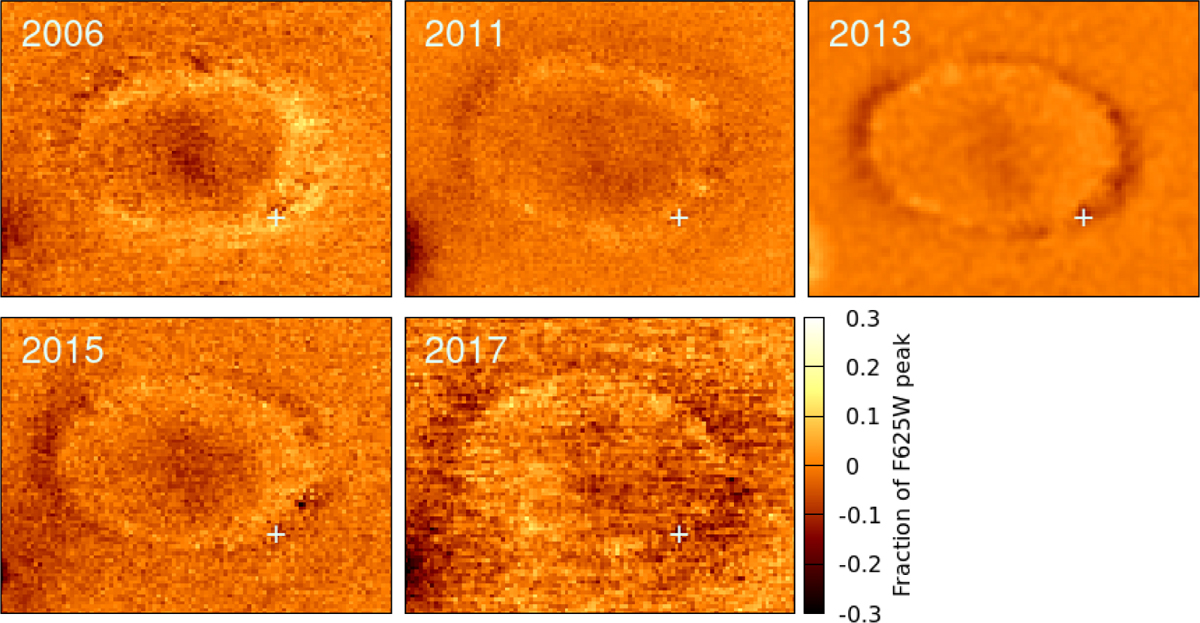
F625W-Ks maps at each epoch, illustrating the stronger diffuse emission in Ks since around 2013. The images were convolved to the same seeing using stars, then normalized to the average hotspot brightness in the F625W image before subtraction in each case. Positive pixels indicate stronger normalized emission in the F625W band than in the Ks band. The location of a star coinciding with the ER is marked with a plus sign. North is up and east is to the left. The field of view is 2.5″ × 2.1″.
Current usage metrics show cumulative count of Article Views (full-text article views including HTML views, PDF and ePub downloads, according to the available data) and Abstracts Views on Vision4Press platform.
Data correspond to usage on the plateform after 2015. The current usage metrics is available 48-96 hours after online publication and is updated daily on week days.
Initial download of the metrics may take a while.