Fig. 13
Download original image
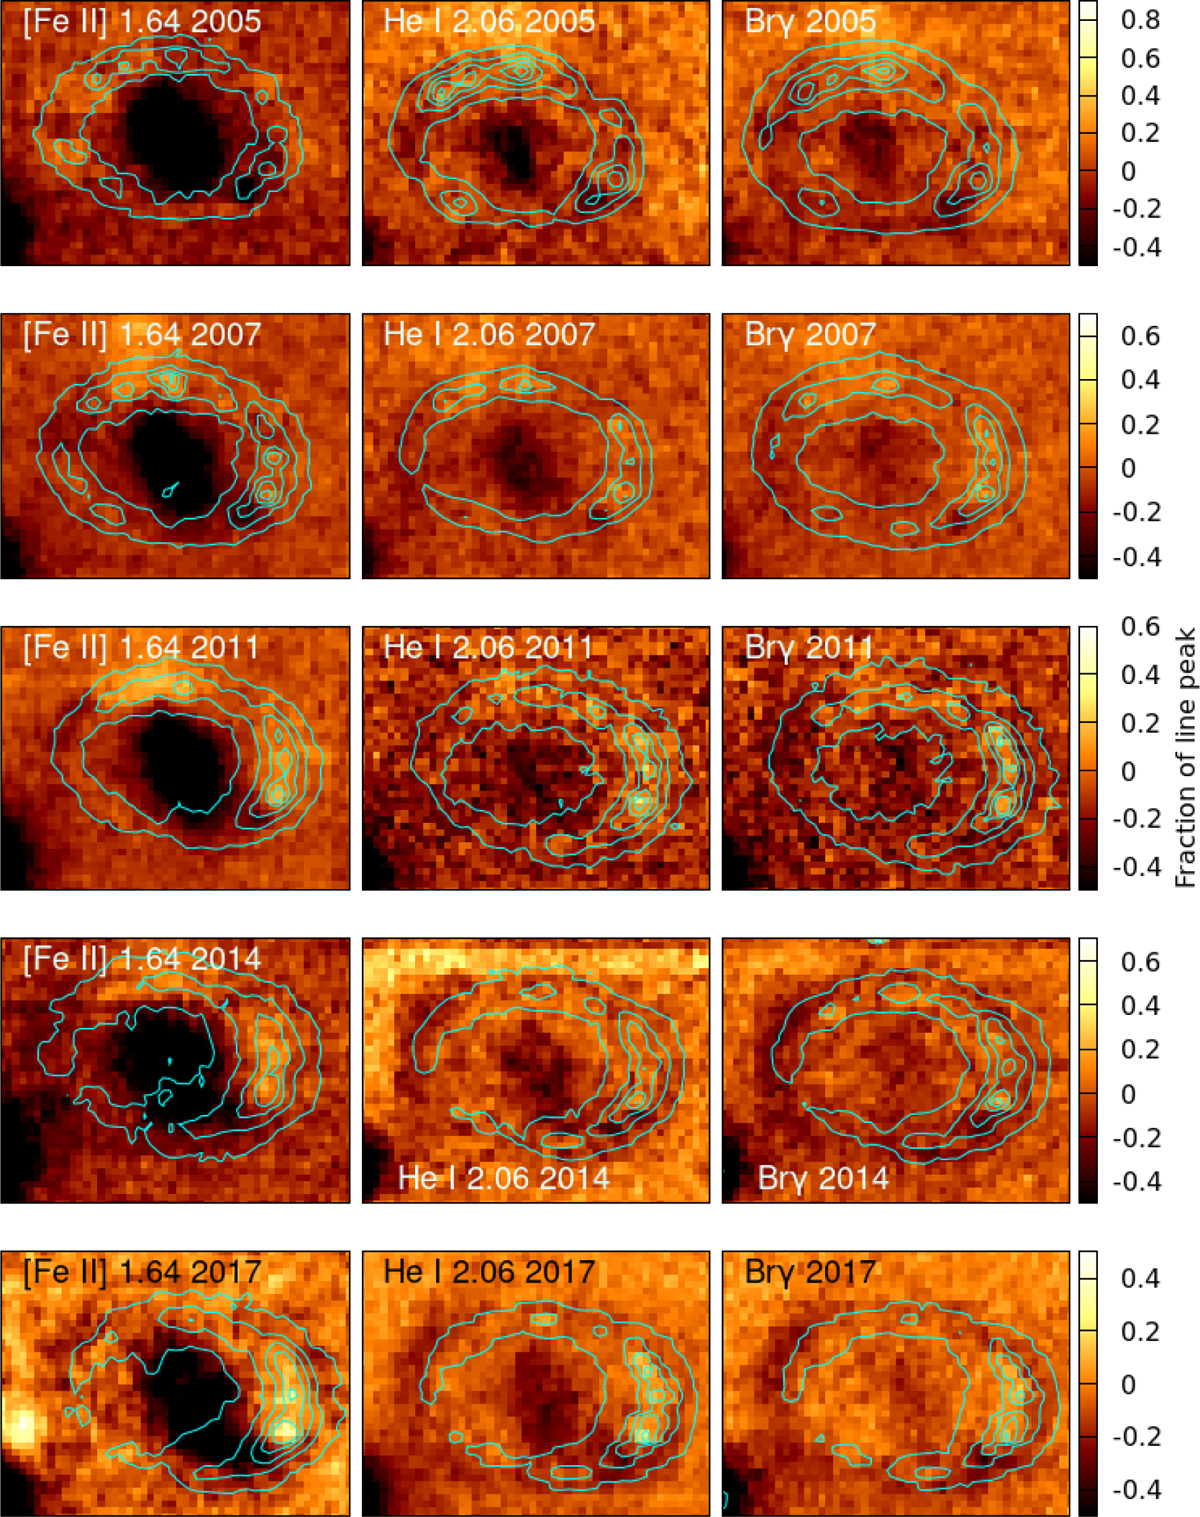
Line minus continuum difference maps of three strong lines at each epoch, normalized using the average hotspot brightness before subtraction. The contours illustrate the extent of the line emission, and positive fluxes indicate that the normalized line emission is stronger than the continuum. The influence of the ejecta and Star 3 is strongest at the weakest ER line of the three, [Fe II] 1.64 µm. Over time, the continuum flux outside the hotspots strengthens compared to the line flux, resulting in a clear negative ring slightly outside the line emission in the later epochs. North is up and east is to the left. The color scale is constant across each row. The field of view is 2.5″ × 2.1″.
Current usage metrics show cumulative count of Article Views (full-text article views including HTML views, PDF and ePub downloads, according to the available data) and Abstracts Views on Vision4Press platform.
Data correspond to usage on the plateform after 2015. The current usage metrics is available 48-96 hours after online publication and is updated daily on week days.
Initial download of the metrics may take a while.