Open Access
Fig. 1
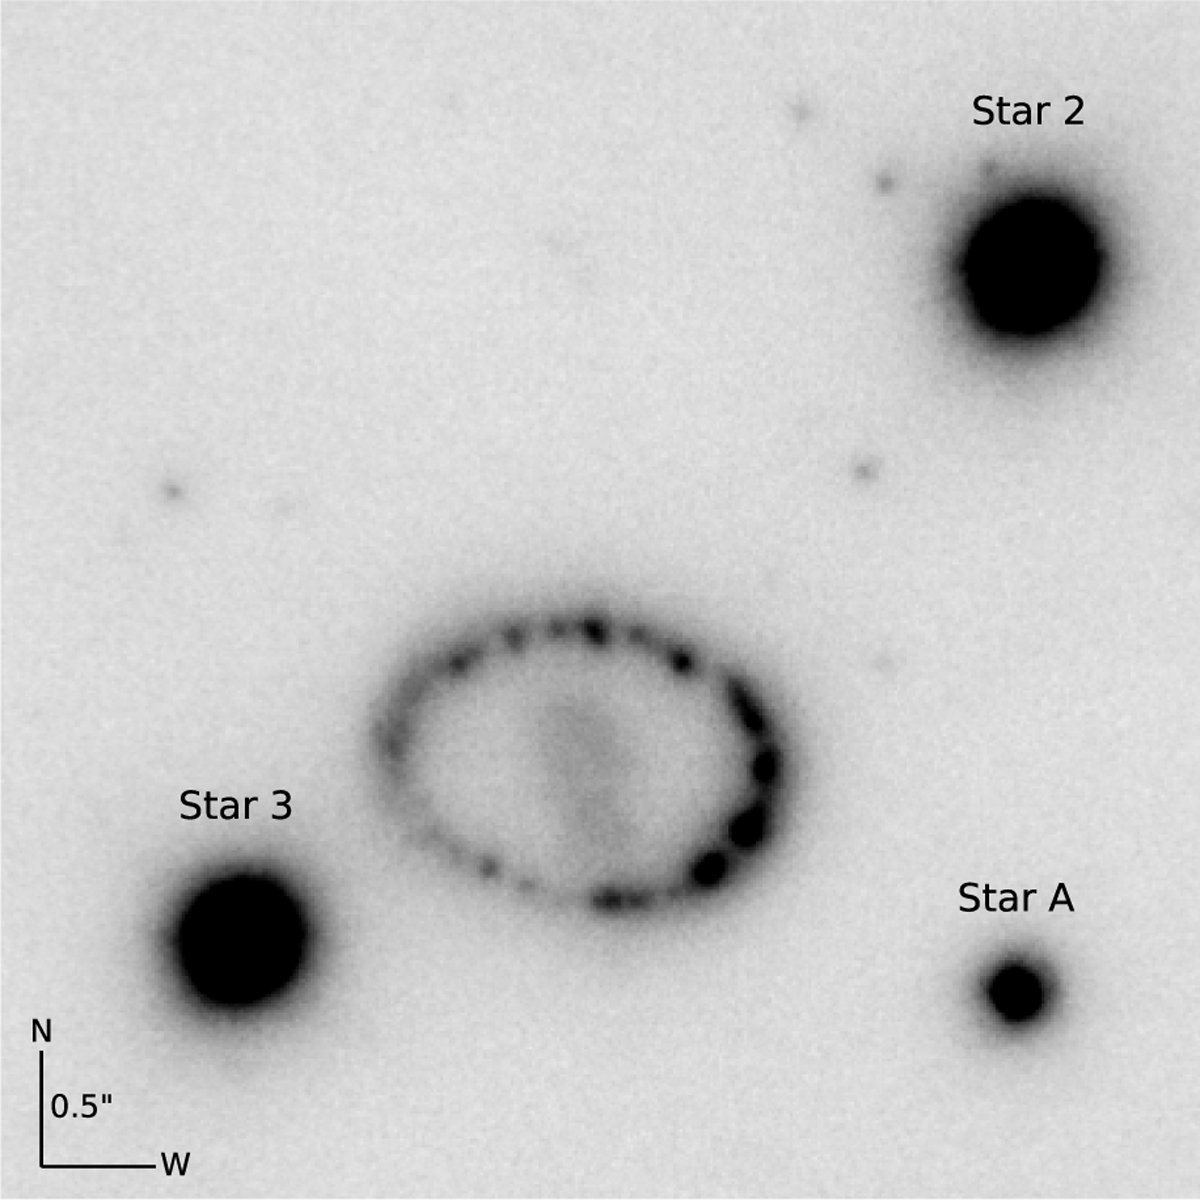
Download original image
Section of the reduced NACO image for the 2010 epoch in the H band, showing the hotspot-dominated ER, the inner SN ejecta in the middle, and nearby bright stars.
Current usage metrics show cumulative count of Article Views (full-text article views including HTML views, PDF and ePub downloads, according to the available data) and Abstracts Views on Vision4Press platform.
Data correspond to usage on the plateform after 2015. The current usage metrics is available 48-96 hours after online publication and is updated daily on week days.
Initial download of the metrics may take a while.