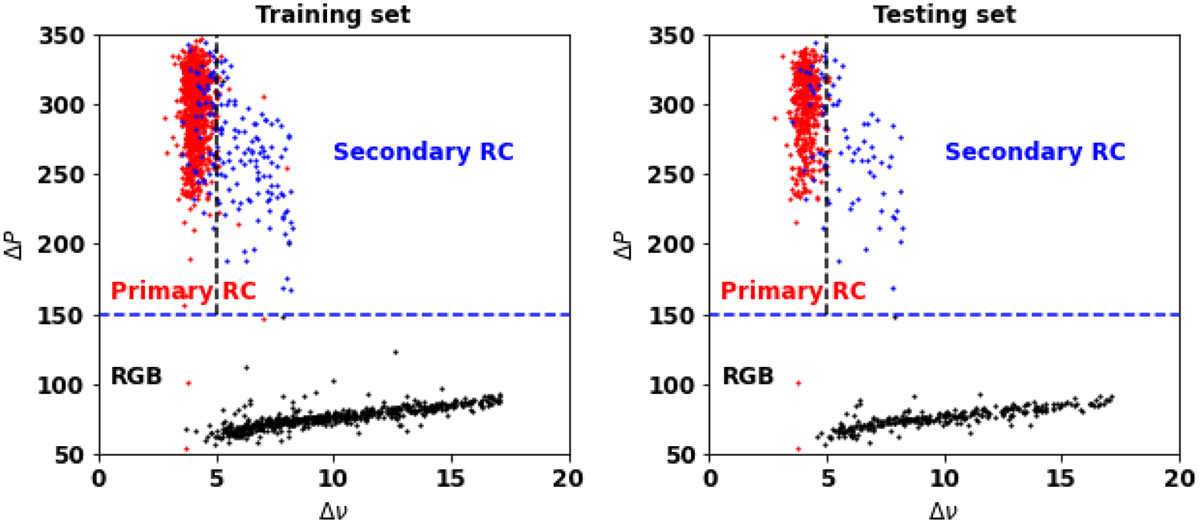
Fig. 2
Download original image
Stellar distributions on the plane of ∆ν–∆P derived using our neural network method for 1800 training (left panel) and 862 testing stars (right panel). The black, red, and blue dots show the 826 RGBs, 1599 primary RCs, and 237 secondary RCs classified by Vrard et al. (2016) using Kepler data, respectively. The blue dashed line (∆P = 150 s) is plotted to separate RGBs and RCs. The black dashed line (∆ν = 5µHz) is plotted to separate primary RCs and secondary RCs.
Current usage metrics show cumulative count of Article Views (full-text article views including HTML views, PDF and ePub downloads, according to the available data) and Abstracts Views on Vision4Press platform.
Data correspond to usage on the plateform after 2015. The current usage metrics is available 48-96 hours after online publication and is updated daily on week days.
Initial download of the metrics may take a while.