Fig. 1
Download original image
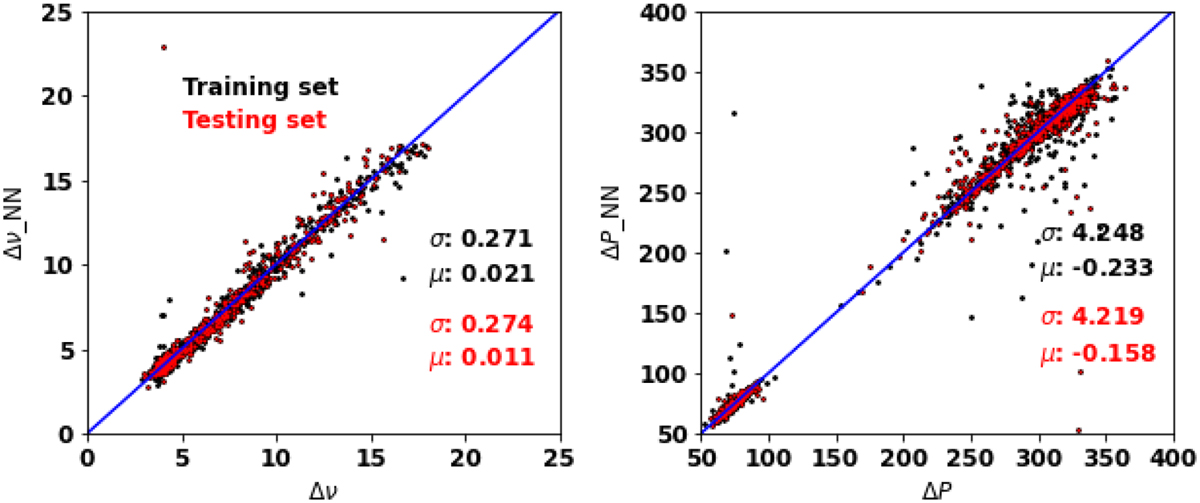
Comparisons of ∆ν and ∆P provided by Vrard et al. (2016) (X-axis) using Kepler data with those derived using our neural network model (Y-axis) for 1800 training (black dots) and 862 testing stars (red dots). The values of the mean and standard deviation of the differences are labelled in the bottom-right corner of each panel.
Current usage metrics show cumulative count of Article Views (full-text article views including HTML views, PDF and ePub downloads, according to the available data) and Abstracts Views on Vision4Press platform.
Data correspond to usage on the plateform after 2015. The current usage metrics is available 48-96 hours after online publication and is updated daily on week days.
Initial download of the metrics may take a while.